Note
Go to the end to download the full example code.
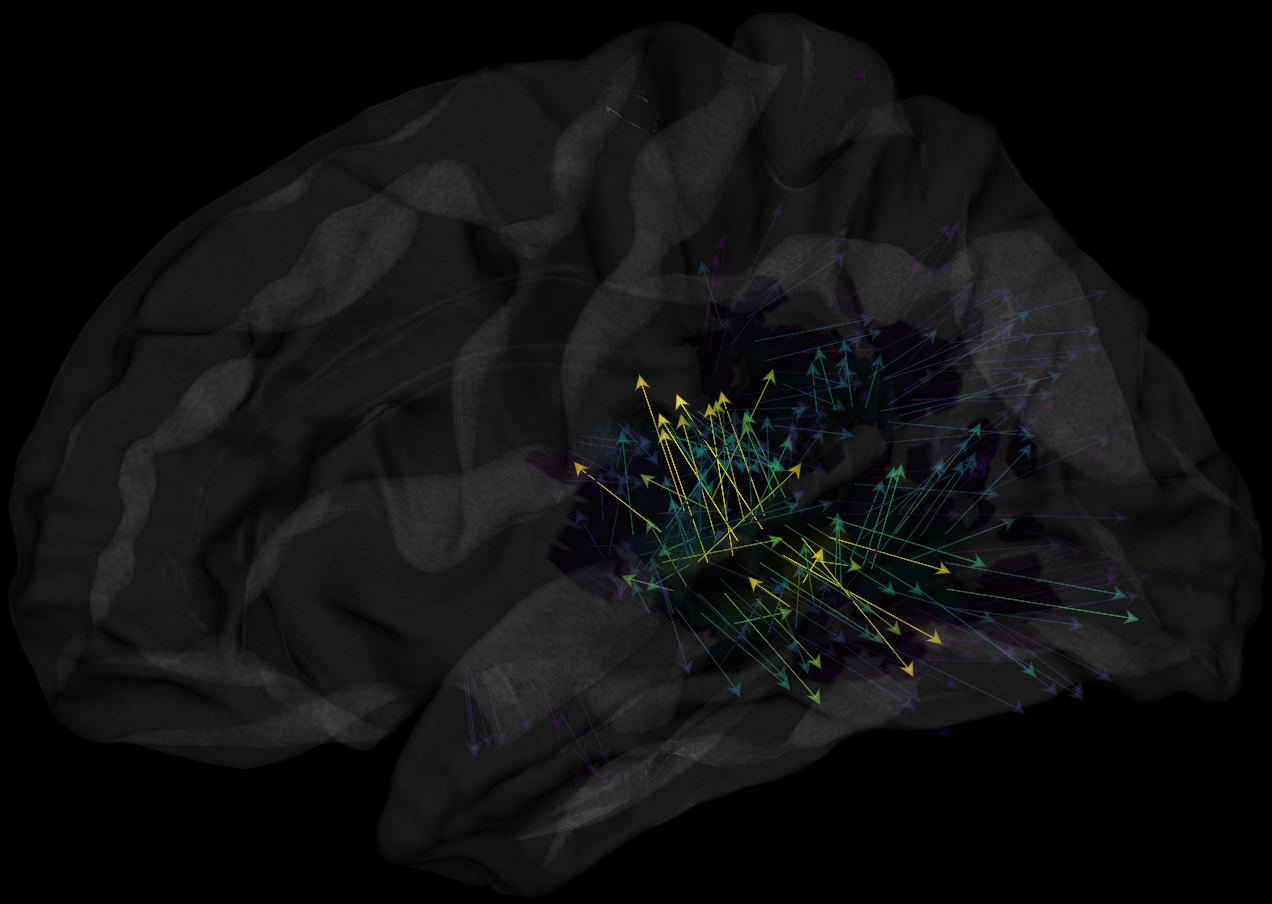
Plot vector-valued MEG inverse solution
Plot vector-valued MEG inverse solution.
See the original example :
import numpy as np

from visbrain.gui import Brain
from visbrain.objects import BrainObj, VectorObj
from visbrain.io import read_stc, download_file

"""Download file if needed
"""
stc_file = download_file('meg_source_estimate-lh.stc', astype='example_data')

# Read the *.stc file :
file = read_stc(stc_file)

# Get the data and vertices from the file :
data = file['data'][:, 2]
vertices = file['vertices']

# Define a brain object and add the data to the mesh :
b_obj = BrainObj('white', translucent=True, hemisphere='left')
b_obj.add_activation(data=data, vertices=vertices, smoothing_steps=5,
                     clim=(7., 21.), hide_under=7., cmap='viridis')

# Build arrows :
dt = np.dtype([('vertices', float, 3), ('normals', float, 3)])
arrows = np.zeros(len(data), dtype=dt)
arrows['vertices'] = b_obj.vertices[vertices, :]
arrows['normals'] = b_obj.normals[vertices, :]
select = data >= 7.

# Define the vector object :
v_obj = VectorObj('vector', arrows, data=data, inferred_data=True,
                  clim=(7., 21.), antialias=True, cmap='viridis',
                  select=select, line_width=2., arrow_coef=1.2,
                  dynamic=(.2, 1.))

# Finally, pass the brain and vector object to the Brain module :
vb = Brain(brain_obj=b_obj, vector_obj=v_obj)
vb.rotate('left')
vb.show()