Note
Go to the end to download the full example code.
Plot a 2D array of data
Dispose a two dimensional array of data into a grid.
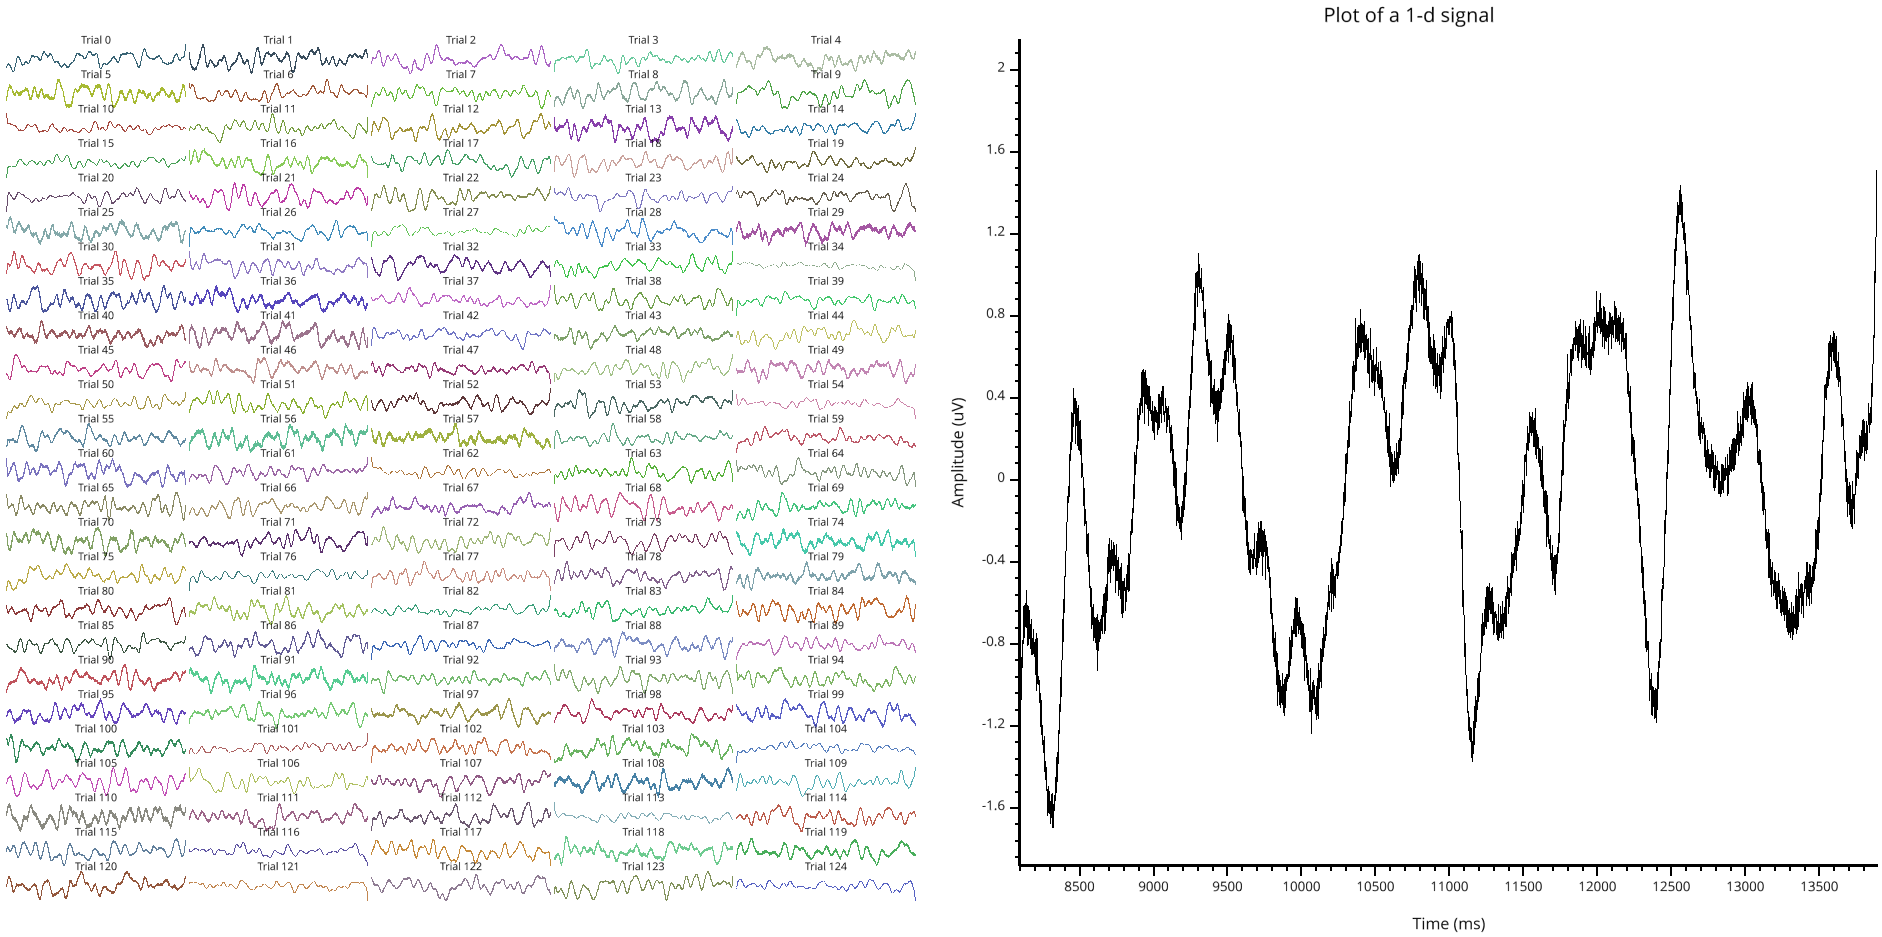
In this example, we generate a dataset of EEG signals composed with 125 trials of 4000 time points each. After opening the interface, you should notice two layouts :
The first one, on the left composed with a grid of all of the 125 signals. To be readable, the grid is re-arranged in a 25 rows by 5 columns of signals. The first signal (0) is localized in the bottom left corner. The last signal (125) is localized in the upper right corner. Finally, double click on a signal to enlarge it.
The right panel can only display one signal but offer multiple plotting forms (line, marker, histogram, time-frequency map, PSD)
Shortcuts
Mouse wheel on the grid canvas : zoom
Mouse press and hold : move the center of the camera
Double click on the grid canvas (left) to enlarge the signal
Double click on the signal canvas (right) to insert annotations
Press <delete> on both to reset the camera
from visbrain.gui import Signal
from visbrain.utils import generate_eeg

sf = 512.       # sampling frequency
n_pts = 4000    # number of time points
n_trials = 120  # number of trials in the dataset

"""Generate a random EEG dataset of shape (n_trials, n_pts). Also get the
associated time vector with the same length as the data.
"""
data, time = generate_eeg(sf=sf, n_pts=n_pts, n_trials=n_trials, smooth=200,
                          noise=100)
time += 8.  # force the time vector to start at 8 seconds
time *= 1000.  # millisecond conversion

"""The data have a shape of (125 channels, 4000 time points). In order to work,
the program need to know that the time axis is not the first dimension. Hence,
we use the `axis` parameter to specify that the time axis is the second one
`axis=1`
"""
axis = 1  # localization of the time axis

"""Add a label to the x-axis (xlabel), y-axis (ylabel) and a title
"""
xlabel = 'Time (ms)'
ylabel = 'Amplitude (uV)'
title = 'Plot of a 1-d signal'

"""Build the title to add to each time-series in the grid
"""
gtitles = ['Trial ' + str(k) for k in range(n_trials)]  # grid titles
gfz = 8.  # grid titles font-size
glw = 2.  # grid line width

Signal(data, sf=sf, axis=axis, time=time, xlabel=xlabel, ylabel=ylabel,
       title=title, grid_titles=gtitles, grid_font_size=gfz,
       grid_lw=glw).show()