1. Sleep
Quick description 
Sleep is a flexible graphical user interface for visualization, analysis and scoring of polysomnographic sleep data and is developed in collaboration with Raphael Vallat and Christian O Reilly. If you use Sleep, please cite the article in Frontiers in Neuroinformatics.
Checkout the API of the visbrain.gui.Sleep class. If you need help with the Sleep module, ask your questions in the dedicated gitter Sleep chat
1.1. Main features
- Modular and responsive GUI
- Take screenshot with controllable dpi
- Save the GUI state (channels, amplitude, panels, checkbox...)
- Default supported files : European Data Format, BrainVision, Micromed, Elan
- Pass raw data or use MNE-python to load other file formats
- Supported extensions for hypnogram files : .txt, .csv, .xlsx, .hyp.
- Polysomnographic data (e.g. EEG, EOG, EMG)
- Time-frequency (=spectrogram)
- Hypnogram
- Topographic map
- Synchronized video
- Flexible definition of vigilance states
- Load, edit and save
- Flexible definition of epochs for scoring
- Real-time computation of sleep statistics
- Export high-quality hypnogram figure
- De-meaning / de-trending
- Filtering
- Re-referencing to a reference channel or common average
- Bipolarization
- Spindles, K-complexes, slow waves, rapid eye movements, muscle twitches and peaks (each detection comes with additional and controllable parameters)
- Can be performed either on single or multiple channels
- Detections are reported on the hypnogram and inside a table
1.2. Import and use sleep
The Sleep module can be imported as follow :
from visbrain.gui import Sleep
# Run the interface (requires loading of a data file):
Sleep().show()
1.3. GUI description
1.3.1. Components
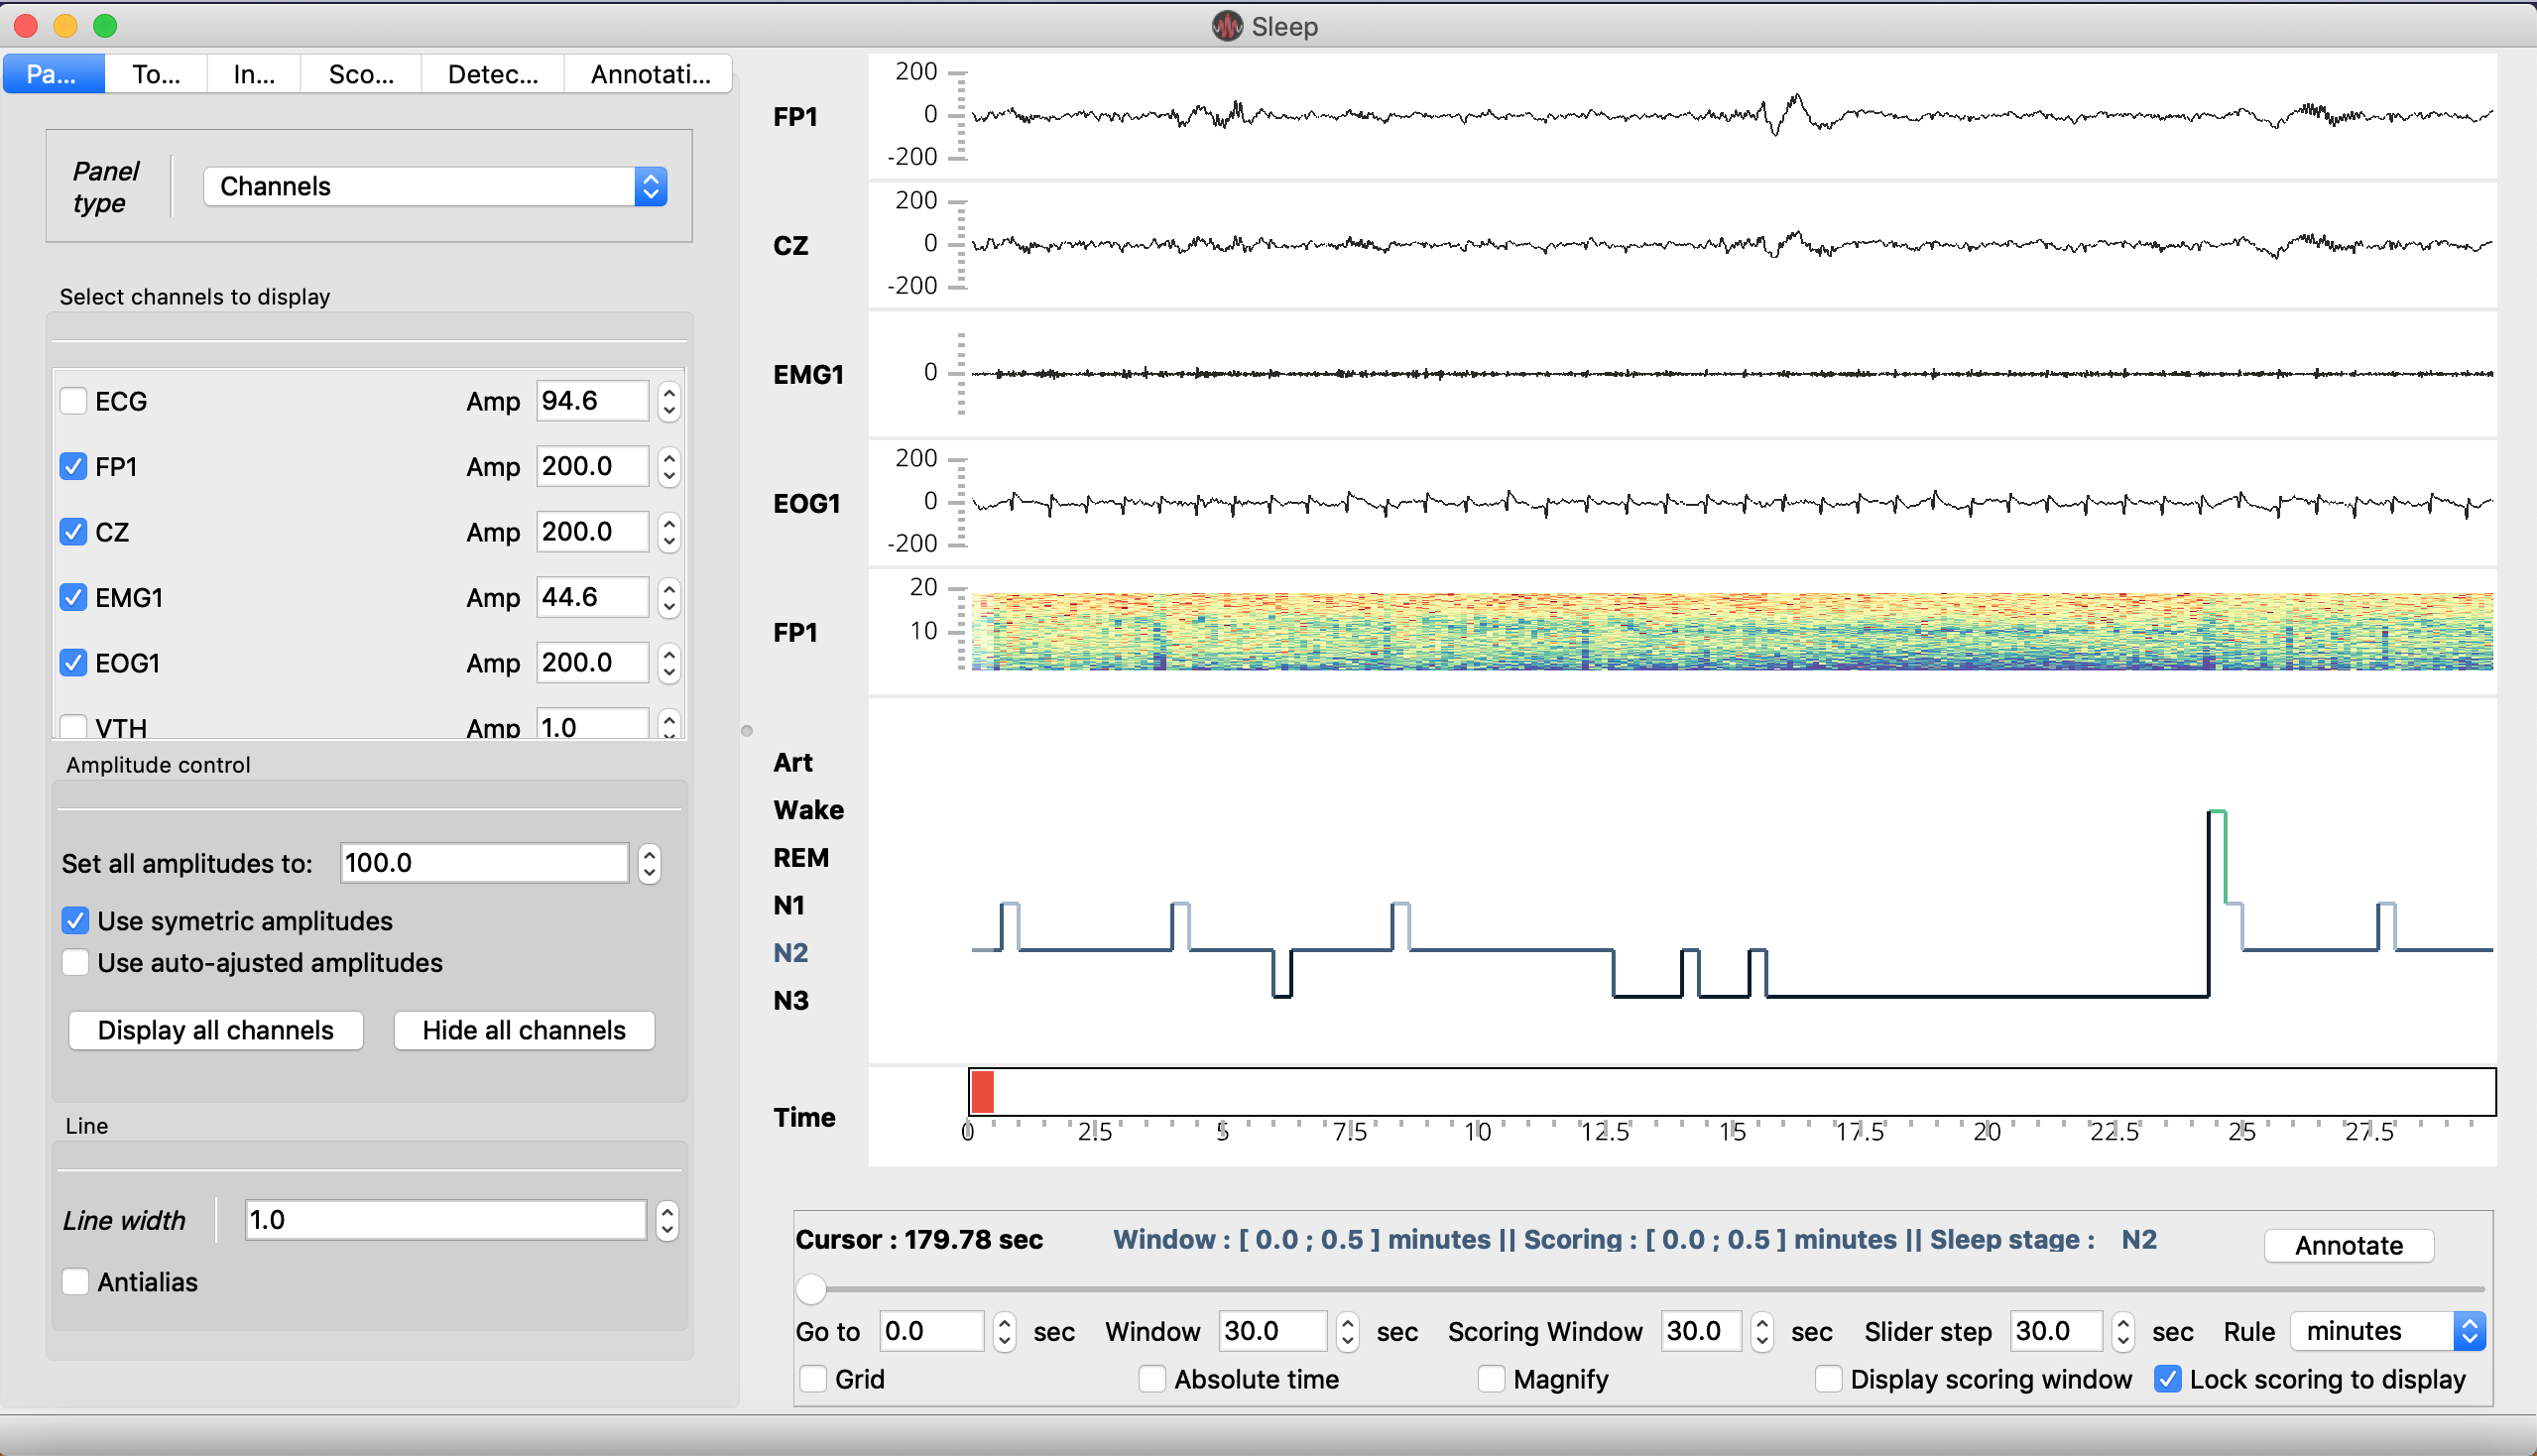
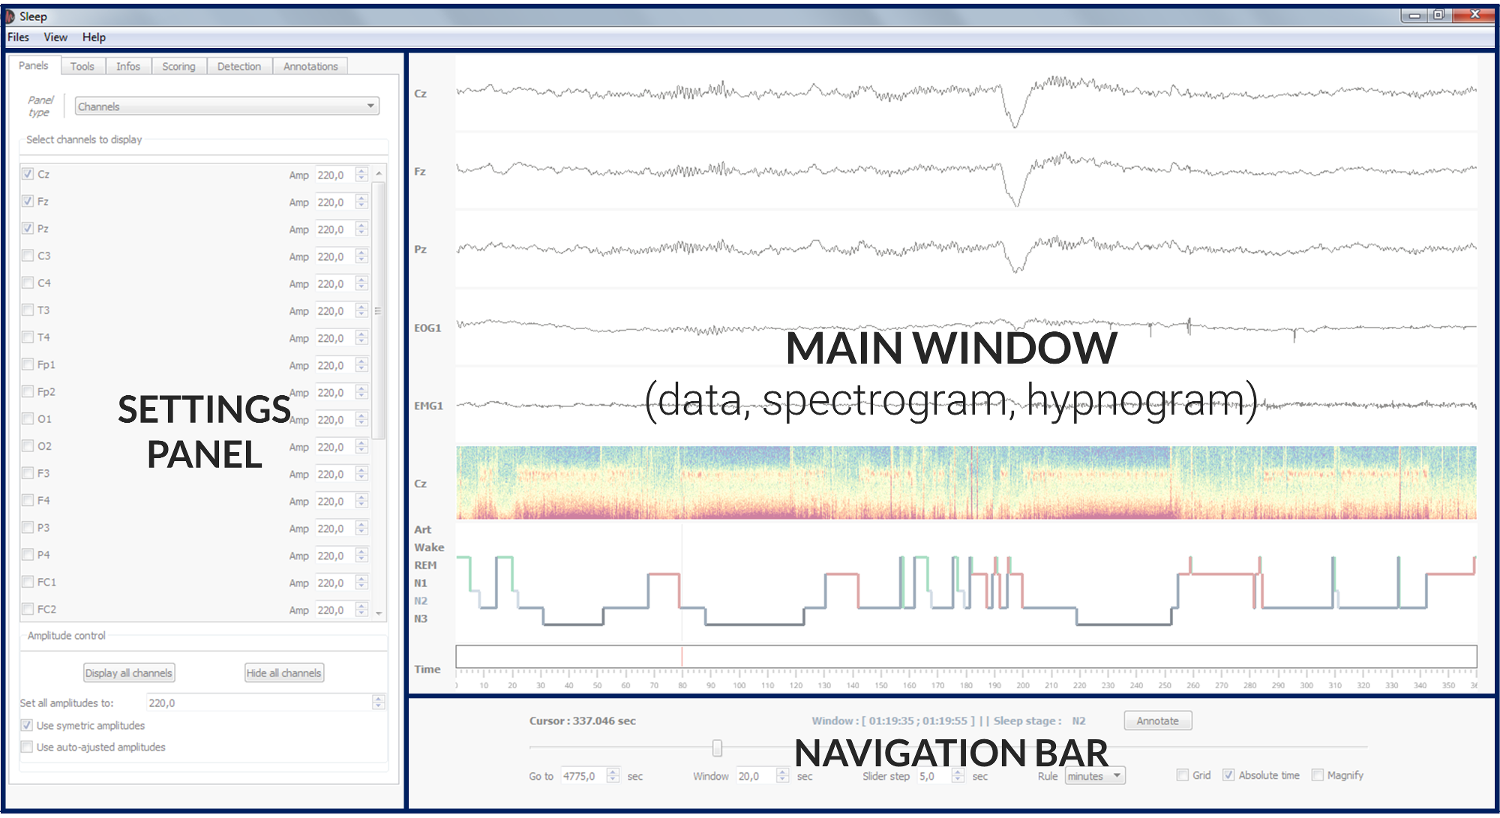
The Sleep GUI is divided into 4 main parts:
Menu : The contextual menu allows to perform several functions such as the loading and saving of data files, hypnogram files, screenshots, GUI configuration.. It is also useful to control the visbility of each panel, display a list of shortcuts, or open the documentation.
- Main window :
Polysomnographic data
Spectrogram (= time-frequency) of the whole recording
Hypnogram
Topoplot (hidden by default)
- Navigation bar :
Go to : go to the time location of your choice
[Display] Window : length of the displayed time window
Scoring window : length of the scoring time window
Slider step : step between each consecutive display windows
Rule : display unit in second, minute or hours
Grid : display the grid on the hypnogram and channel plot
Magnify : apply a zoom on the signal (e.g. useful to examine short events such as spindles). Alternatively, you can use CTRL + click at any time to zoom on a specific signal and time point.
Display scoring window : Hide or display vertical bars onto the data to indicate the limits of the current scoring window.
Lock scoring to display : When this option is selected (default), the scoring window is equal to the display window. When this option is off, the epoch used for scoring can be independent from the displayed epoch. See Hypnogram scoring..
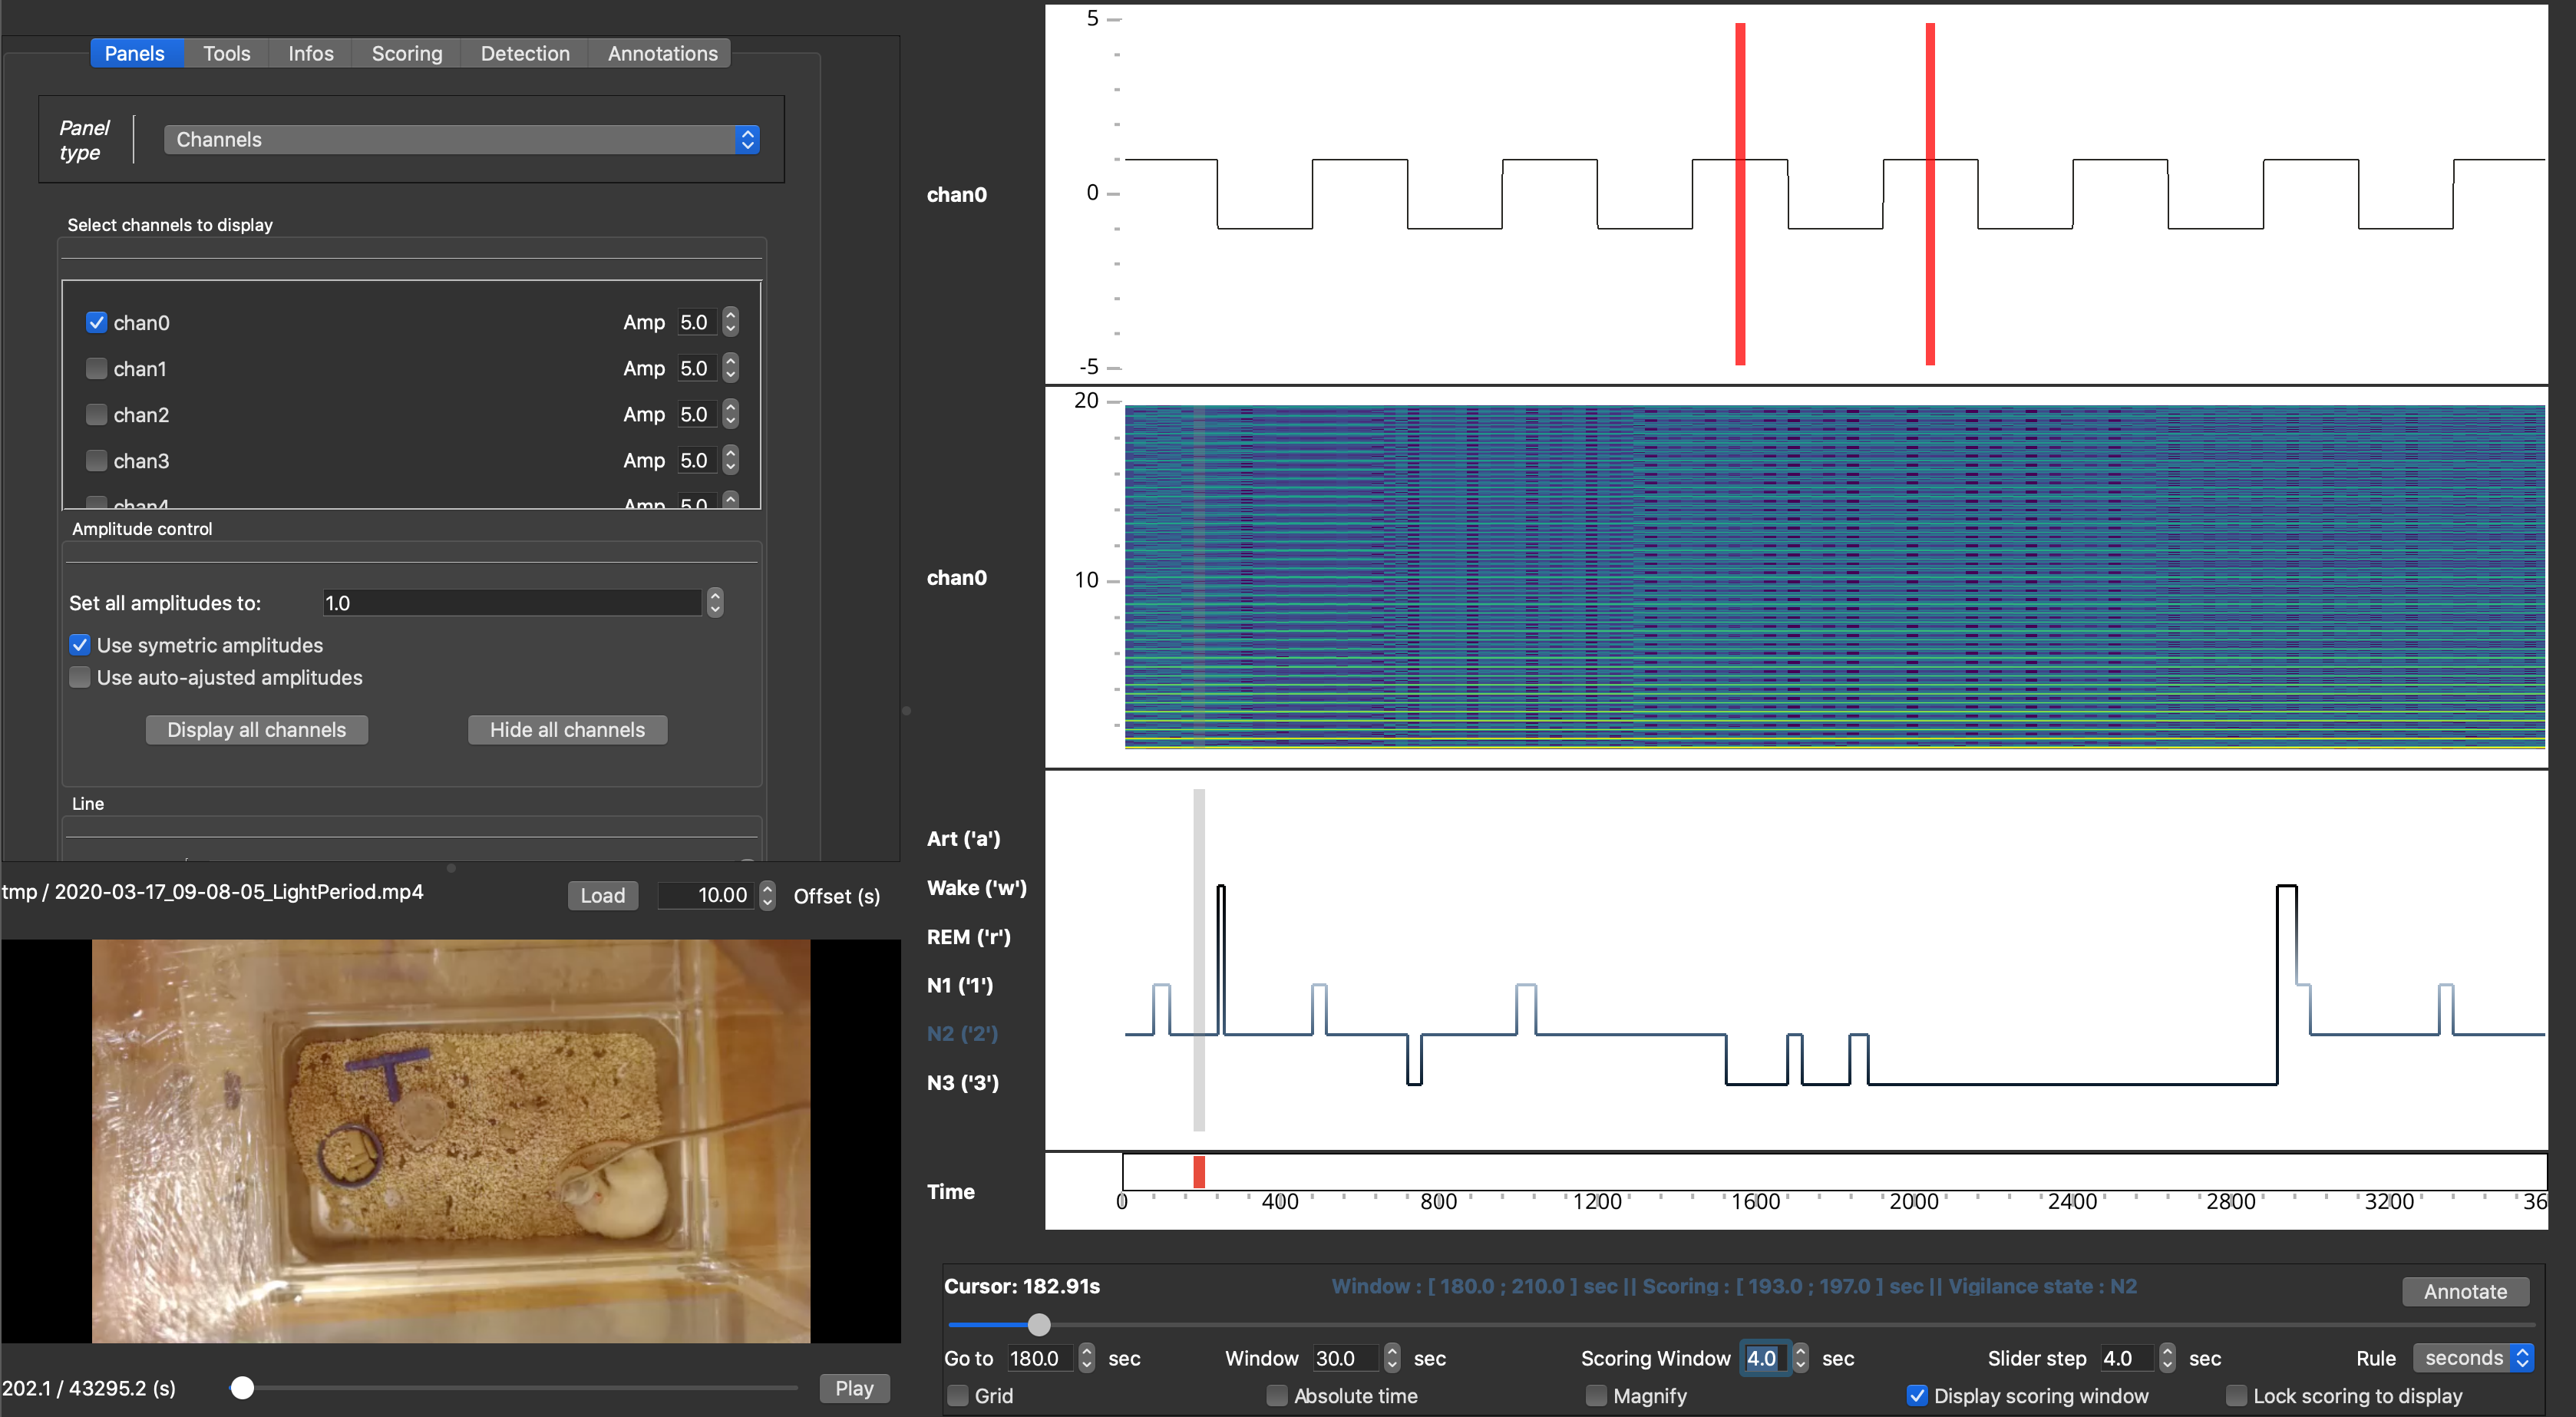
Settings panel : The setting panels is where most of the (advanced) functions of the software are! Among other things, you can control which channel to display, adjust the amplitudes, customize the spectrogram and hypnogram, compute the duration of each vigilance state, add annotations to the recording, and perform a bunch of semi-automatic detection (spindles, K-complexes…). See the section Settings panel tabs for a description of each tab.
Video panel : The video panel (revealed with the shortcut “v”) displays frames of a video file synchronized to the data. See _video.
1.3.2. Settings panel tabs
There are five settings tabs :
Panels : manage channel, time-frequency, hypnogram and topographic map
Tools : signal processing tools (e.g filtering, re-referencing)
Infos : sleep statistics and basic infos on the EEG recording
Scoring : a scoring table that can be used to edit the hypnogram
Detections : automatic events detections
Annotations : manage annotations
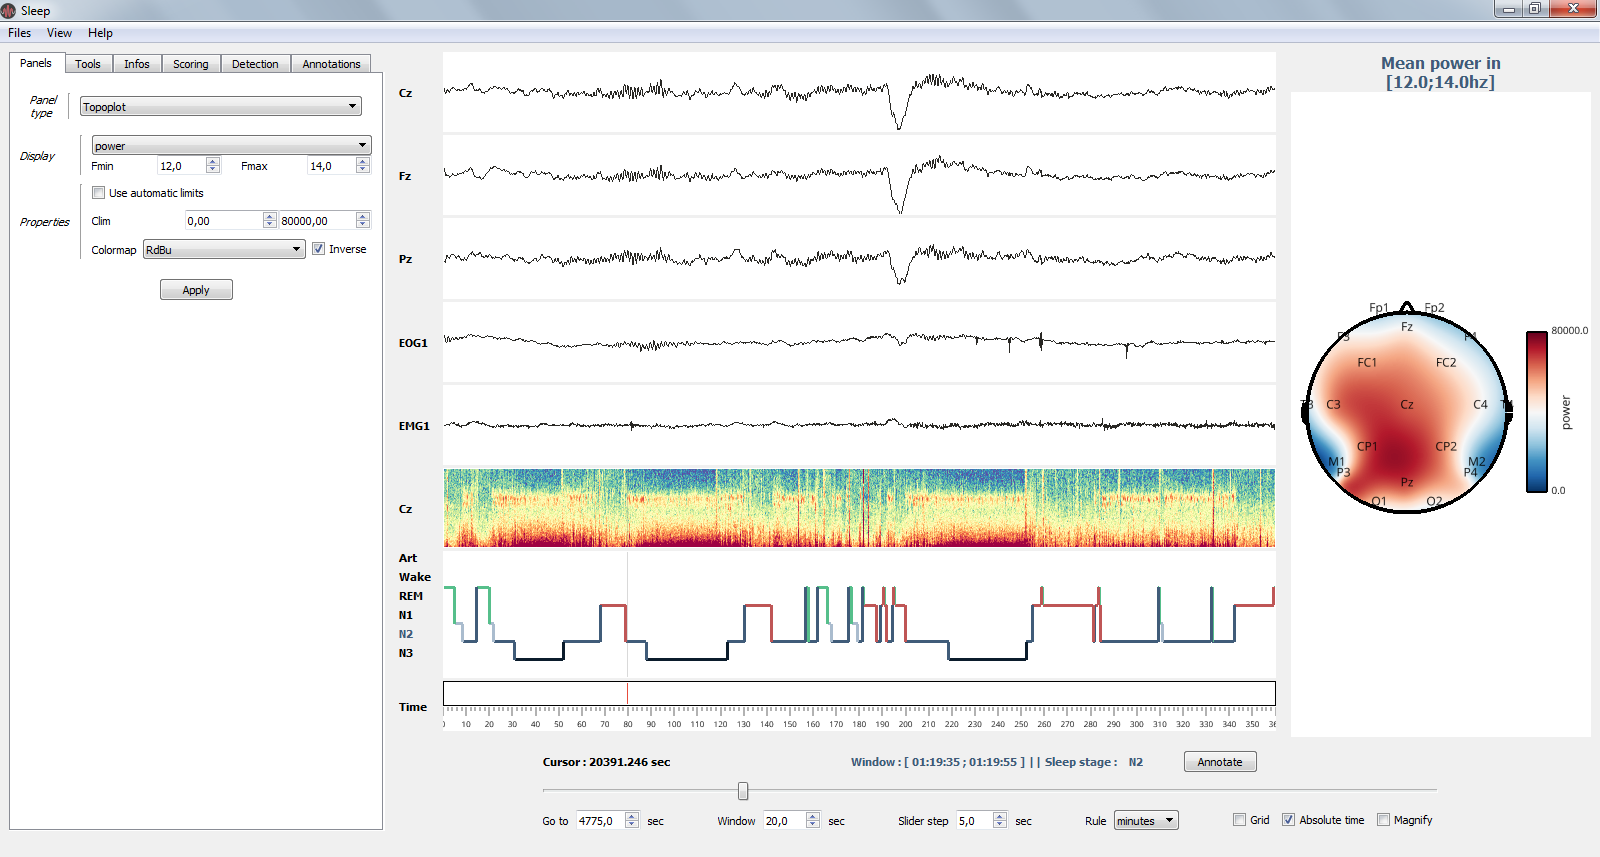
1.3.2.1. Panels
Manage channel, time-frequency, hypnogram and topographic map
The Settings panel: topoplot properties
- Channels
- Show / hide channels :
Select the channels to display by clicking on the corresponding checkbox
Alternatively, you can click on display / hide all channels
- Control the amplitude :
Per channel
By setting all amplitudes at once
Use symmetric amplitudes (-M, +M)
Use automatic amplitude (each amplitude fit to the (minimum, maximum) of the current displayed window)
- Time-frequency
- Customize the spectrogram
Channel on which to compute the time-frequency
Computation method (see Time-frequency)
Starting and ending frequencies
Time length window and overlap
Colormap
- Hypnogram
- Customize the hypnogram
line width and line color
- Topoplot
- Customize the topographic map (topoplot)
Show / hide topoplot
Display either the filtered signal, the amplitude or the power in specific frequency band
Colormap control
1.3.2.2. Tools
Signal processing and re-referencing tools.
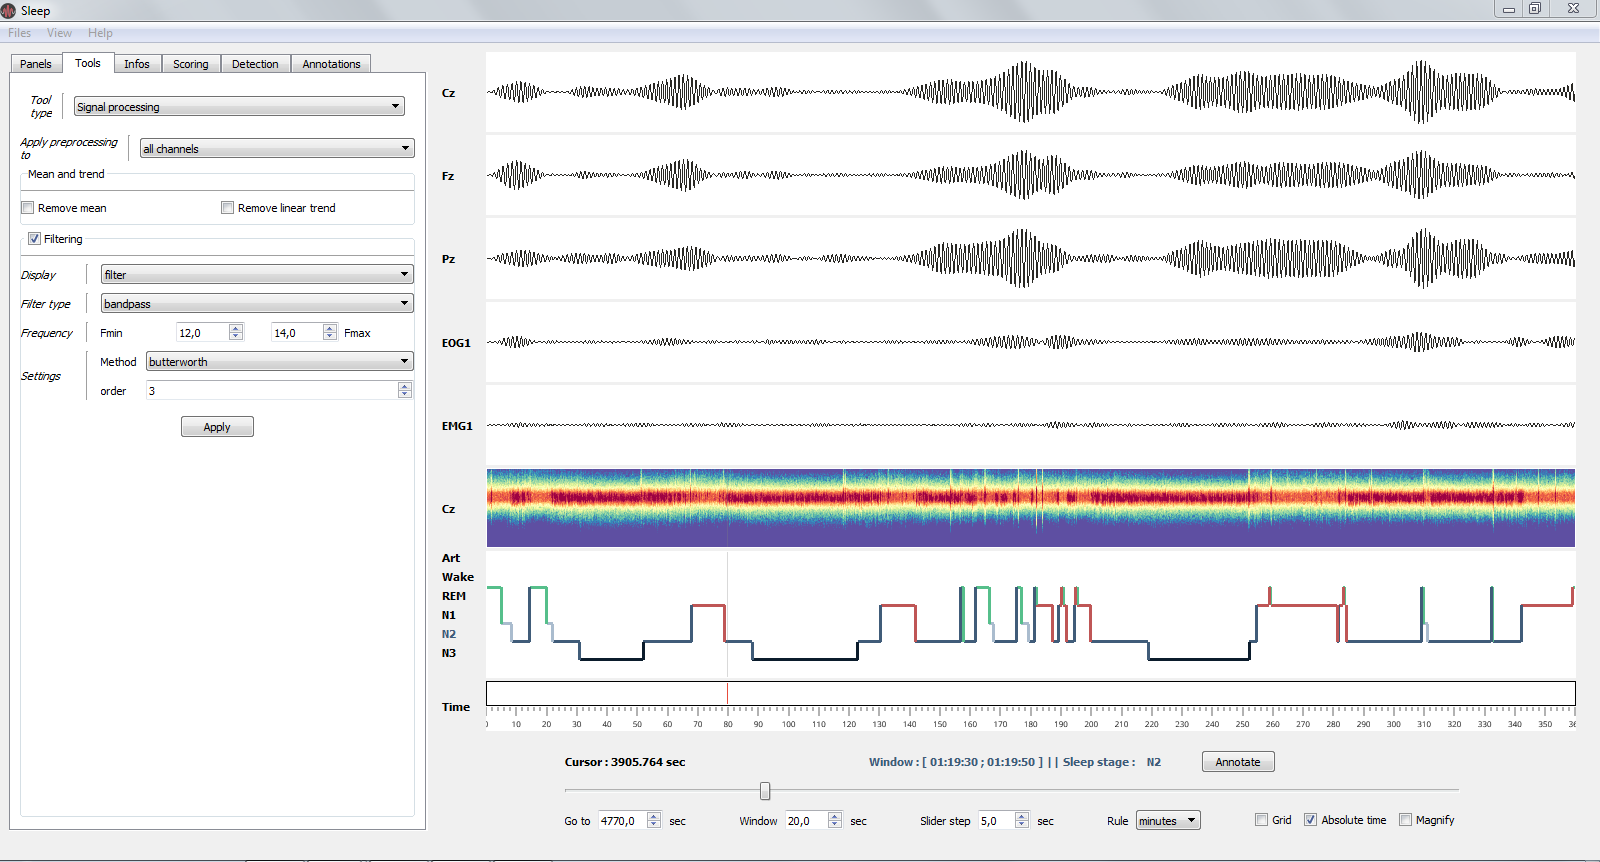
Bandpass filter (12-14 Hz) applied on all channels.
- Signal processing (apply in real time)
Apply de-meaning and de-trending
filtering* and re-referencing which are applied directly on the signal and spectrogram (see image above)
- Re-referencing
Common average
Bipolarization (useful for intra-cranial EEG data)
1.3.2.3. Infos
The Infos panel displays the recording infos (e.g. name and downsampling frequency) as well as the main sleep statistics computed with the hypnogram (see specs below). These values are adjusted in real-time when you edit the hypnogram. Sleep statistics can be exported to .csv or .txt file.
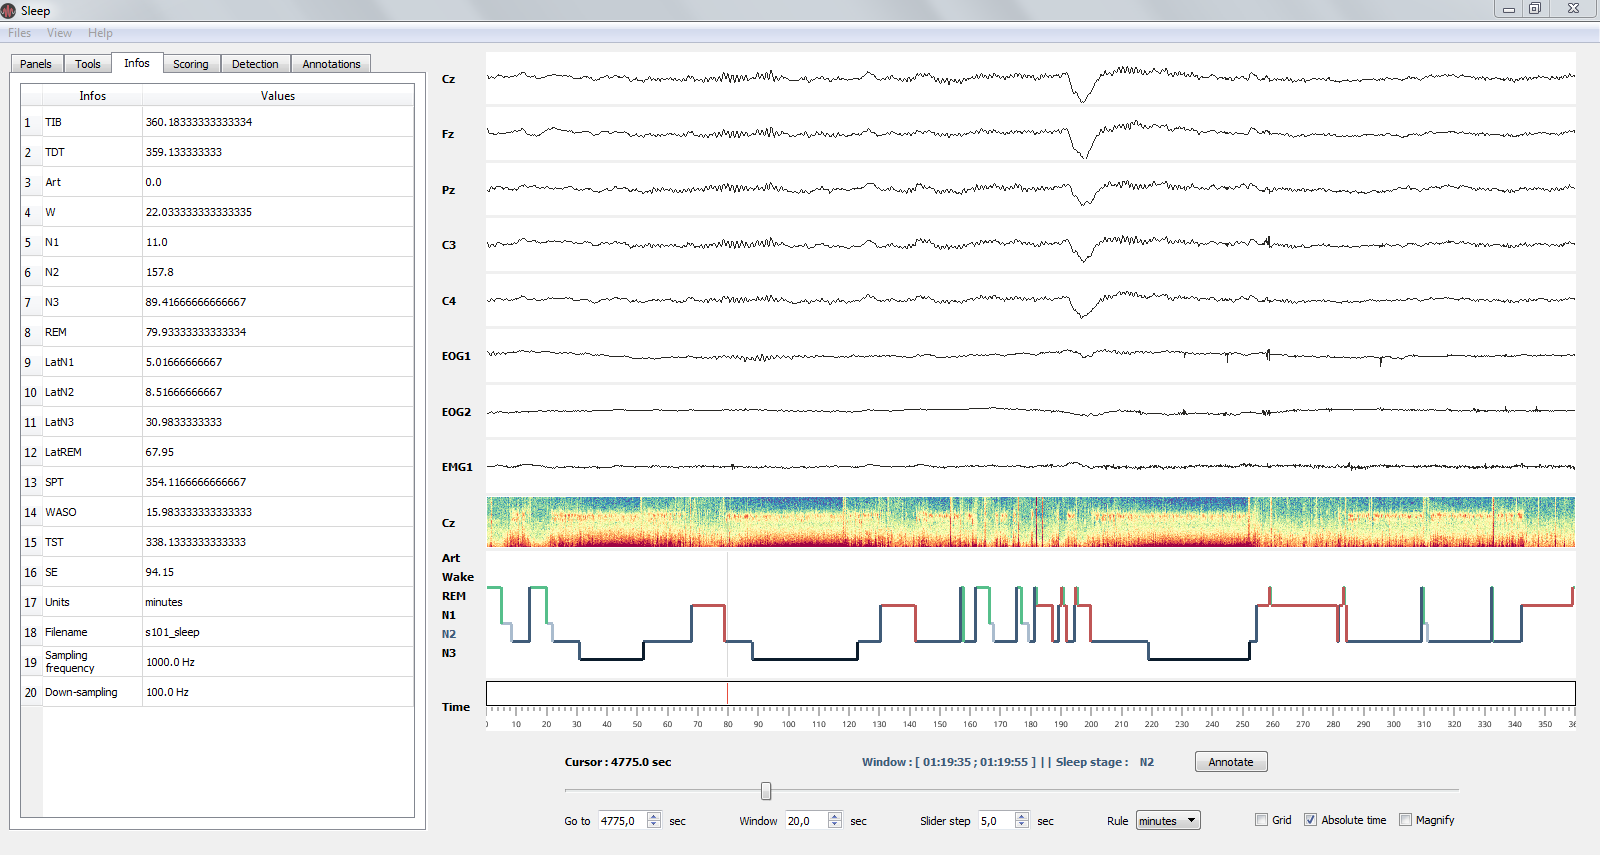
The Infos panel: sleep statistics and basic infos of the current recording.
- File properties
Filename
Sampling frequency
Down-sampling frequency
- Sleep statistics (All values are expressed in minutes):
Time in Bed (TIB) : total duration of the hypnogram
Total Dark Time (TDT) : duration of the hypnogram from beginning to last period of sleep
Sleep Period Time (SPT) : duration from first to last period of sleep
Wake After Sleep Onset (WASO) : duration of wake periods within SPT
Sleep Efficiency (SE) : TST / TDT * 100 (%)
Total Sleep Time (TST) : SPT - WASO
Vigilance state duration: “Wake”, “N1”, “N2”, “N3” and “REM” by default
Latencies of vigilance states from the beginning of the record: “LatWake”, “LatN1”, “LatN2”, “LatN3” and “LatREM” by default
1.3.2.4. Scoring
This tab contains the scoring table, i.e. where each state start and finish. For further informations about how to score your hypnogram see Hypnogram scoring.
1.3.2.5. Detections
Perform semi-automatic detection of phasic events, such as sleep spindles, K-complexes, rapid eye movements…For a full tutorial see Apply semi-automatic detection.
1.3.2.6. Annotations
Add and edit annotations (annotations are defined by a start and end point, as well as an optional text marker). To quickly add annotations:
Use the Annotate button in the ruler to annotate the entire window
Double click (with left mouse button) on a channel to add an annotation starting and finishing at the mouse cursor location.
If you want to import / export annotations, see the Import, add and save annotations
1.3.3. Shortcuts
Sleep comes with a bundle of shortcuts that can be used to speed up your productivity. If shortcuts do not work, simply left click on a canvas.
Keys |
Description |
|---|---|
mouse wheel |
Move the current window |
double left click |
Add annotation under mouse cursor |
- |
Decrease amplitude |
+ |
Increase amplitude |
b |
Previous window |
n |
Next window |
s |
Display / hide spectrogram |
t |
Display / hide topoplot |
h |
Display / hide hypnogram |
p |
Display / hide navigation bar |
x |
Display / hide time axis |
g |
Display / hide grid |
v |
Display / hide video |
z |
Enable / disable zoom |
i |
Enable / disable indicators |
CTRL + Num |
Display / hide the channel Num [0, 9] |
CTRL + left click |
On a channel canvas, magnify signal under mouse location |
CTRL + d |
Display quick settings panel |
CTRL + s |
Save hypnogram |
CTRL + n |
Screenshot window |
CTRL + e |
Display documentation |
CTRL + t |
Display shortcuts window |
CTRL + q |
Close the window |
Some shortcuts are used for scoring the current epoch and may be modified by the user (see Hypnogram section). By default, the vigilance states and their corresponding shortcuts are the following:
Keys |
Description |
|---|---|
a |
Score the current epoch as Artefact |
w |
Score the current epoch as Wake |
1 |
Score the current epoch as N1 |
2 |
Score the current epoch as N2 |
3 |
Score the current epoch as N3 |
r |
Score the current epoch as REM |
1.3.4. Video
The video panel can be revealed with the shortcut v.
User can specify a file and the offset between the start of the recording and the start of the video (in seconds) either by specifying the video_file and video_offset kwargs when starting the Sleep GUI, or with the corresponding widgets in the video panel.
Note that the video formats supported are the same as those supported by the QMediaPlayer class in Qt, and may vary depending on the platform. .mp4 is a safe bet.
A positive offset means the video was started before the recording.
When the location of the current scoring window changes, the frame displayed is synchronized to the start of the scoring window (which may differ from the display window.)
Note
Updating frames takes time. If you experience speed issues, try reducing the frame rate or resolution of the video, or hide the video panel.
Important
Due to inherent limitations of the backend, it is possible that the timestamp of the frame displayed differs significantly from the requested frame for compressed videos. This is because only “key-frames” (or I-frames) can be selected for display by Qt. If you experience this issue, you may try increasing the number of i-frames in your files (eg using ffmpeg).
1.4. Supported files and format
Sleep natively supports several file formats for both electrophysiological and hypnogram data.
1.4.1. Data files
Here’s the list of natively supported file formats:
.vhdr (BrainVision version 1 and 2)
.edf (European Data Format)
.trc (Micromed version 4)
.eeg (ELAN)
If MNE-python is installed, this list is extended to (see also) :
.bdf
.gdf
.egi
.mff
.set (EEGLAB)
.cnt
.vhdr (BrainVision files can be loaded using either the native library of Sleep or using MNE)
Note that once MNE-python is installed, the loading of these file formats is transparent for users. It means that you can load these file formats directly using Sleep graphical user interface or command-line, without any additional steps. We therefore strongly recommand to install MNE-python.
If you have a file format that is currently not supported, Sleep also provide the ability to directly pass raw data (NumPy array). Please click see this example of how to to load a Matlab file and then pass the data directly to Sleep.
Note
If you are having trouble with the loading of .edf files, we recommand installing MNE-python and then loading your data using the following command:
Sleep(data='mydata.edf', hypno='myhypno.csv', use_mne=True).show()
This will force the loading of the .edf files using MNE, which can generally handle more cases and exceptions than the native EDF library implemented in Sleep.
Caution
By default, data are automatically downsampled to 100 Hz upon loading. If the sampling frequency of your recording is a power of two (e.g. 256, 512 Hz), we recommand to change the default downsampling value to 128 Hz using the following command:
Sleep(data='mydata.edf', hypno='myhypno.csv', downsample=128).show()
1.5. Hypnogram
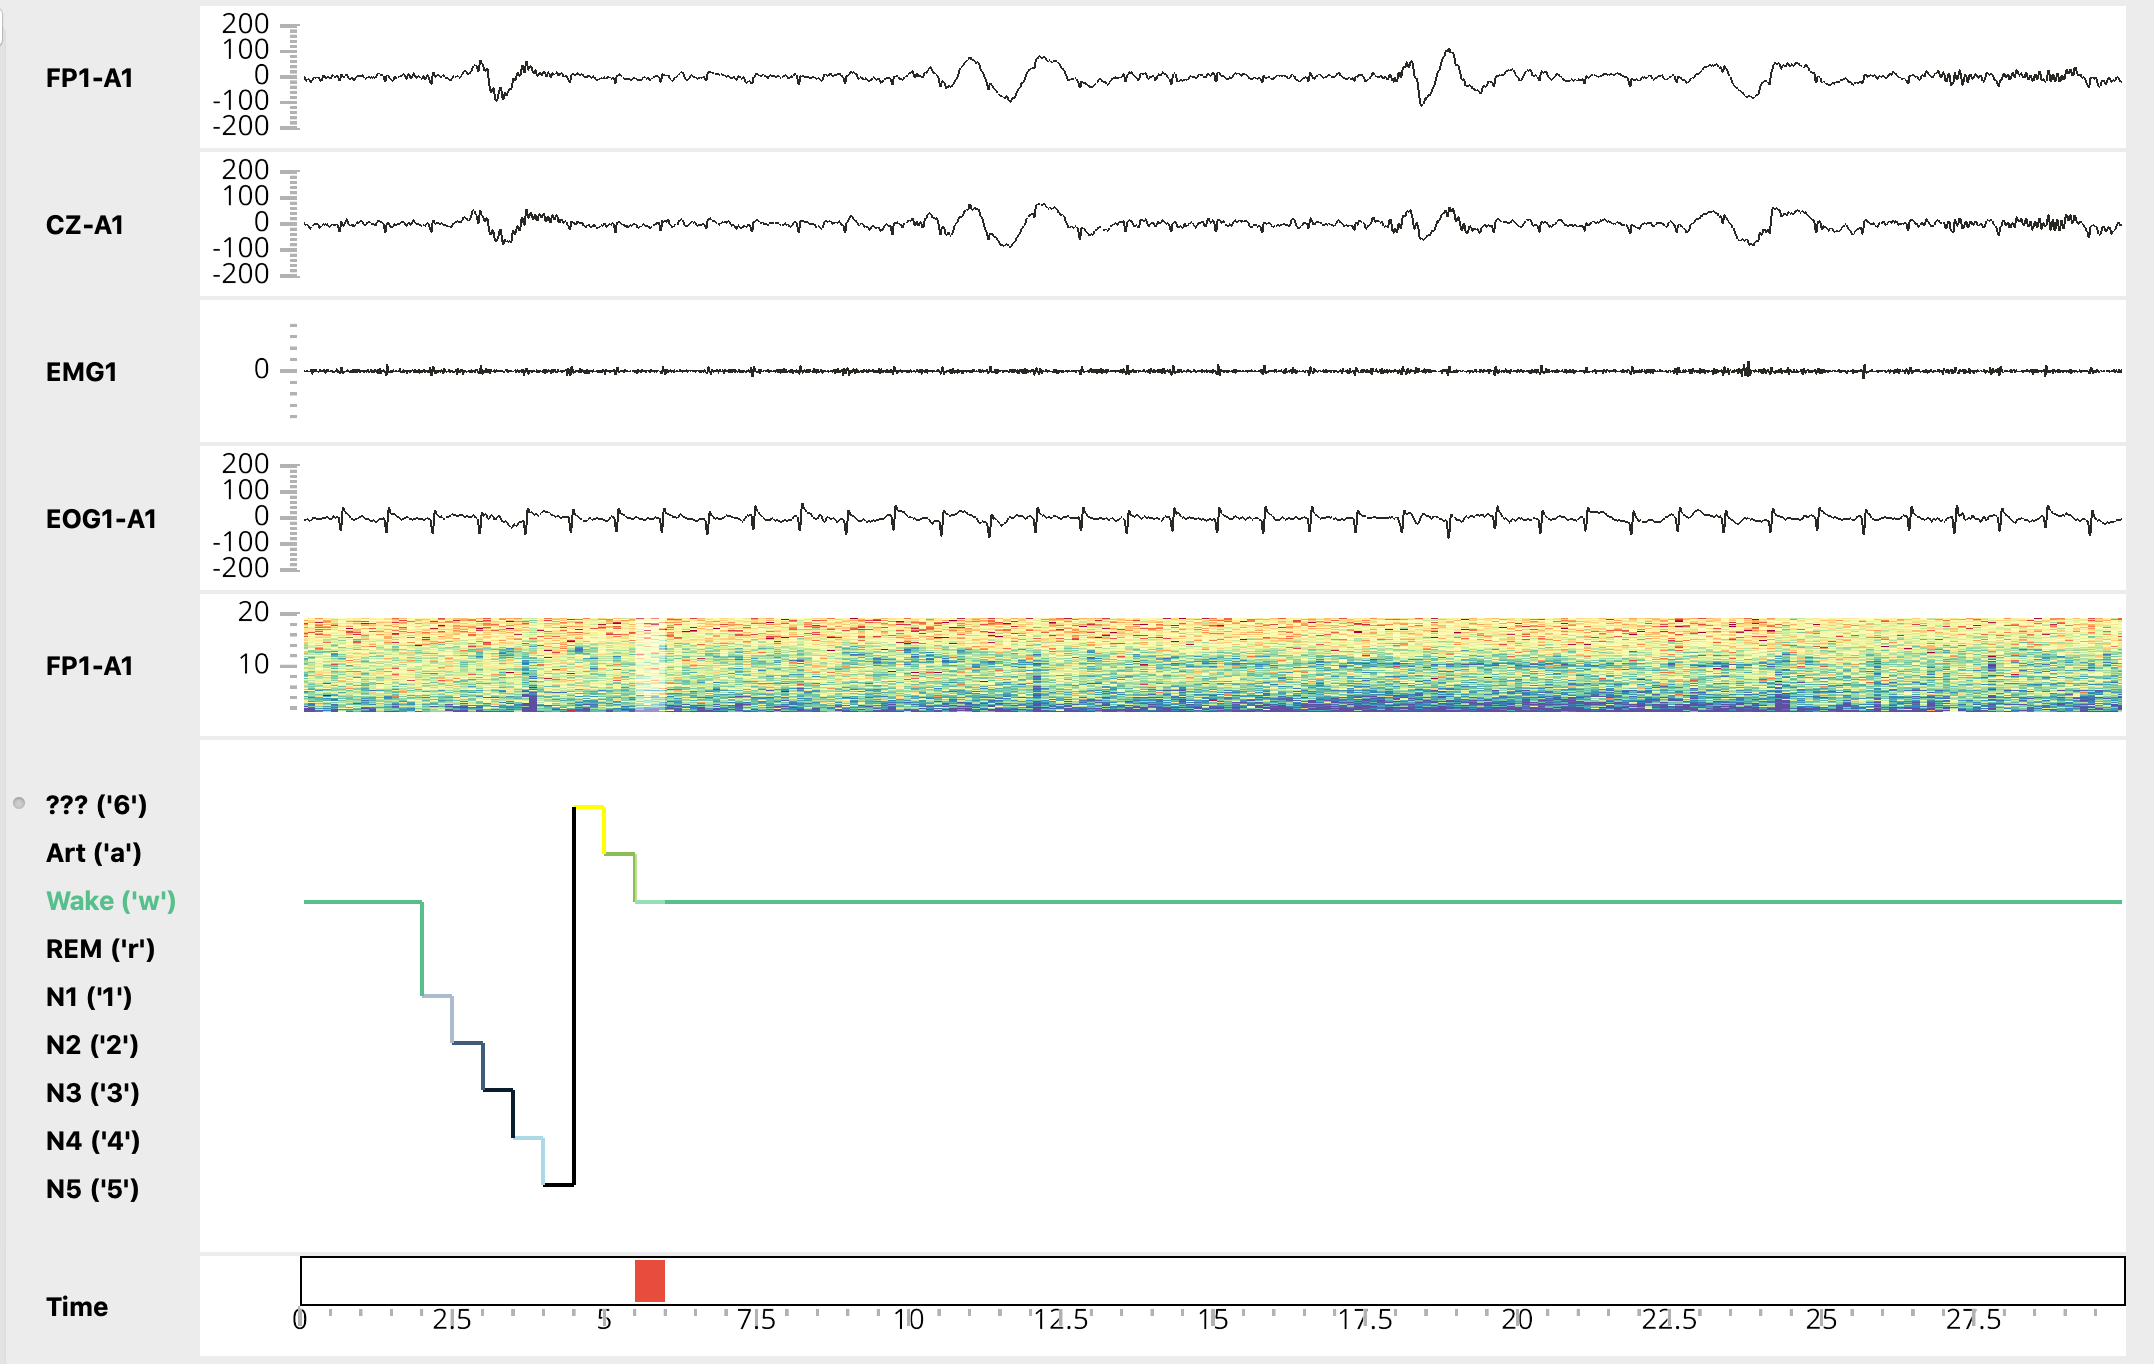
1.5.1. User-defined vigilance states configuration
By default, Sleep uses the guidelines of Iber et al. 2007 for vigilance states nomenclature. Each vigilance state has an associated shortcuts for scoring, and numerical value on point-per-second hypnograms (see below), as follows:
========== ====== ======================================================
State Value Shortcut ========== ====== ====================================================== Wake 0 ‘w’ Art -1 ‘a’ N1 1 ‘1’ N2 2 ‘2’ N3 3 ‘3’ REM 4 ‘4’
However, Sleep also offers the possibility to specify custom configuration for vigilance states:
1. Create a yaml file formatted as follows:
Note that the keys listed in the Shortcuts section are reserved and can’t be used as shortcuts for scoring.
Specify the path to you vigilance states configuration file when creating a Sleep instance with the states_config_file kwarg as follows:
If the states_config_file kwarg is not specified, Sleep will use the default configuration.
1.5.2. Supported hypnogram formats
One of the main objective of Sleep is to facilitate the sharing of data across laboratories. This involves being able to accomodate for a variety of hypnogram format (unfortunately, there is no current gold standard on how to save hypnogram data). Here’s the list of supported extensions for hypnogram files :
.txt
.csv
.xlsx
.edf (EDF+)
.hyp (ELAN)
Warning
Note that during loading of edf-style (.edf or .txt) and Elan-style (.hyp) hypnograms, NREM-S3 and NREM-S4 sleep states will be merged into the N3 vigilance state. That also means that if you load and then save your hypnogram in Sleep, you will loose differentiation between S3 and S4 so be sure not to overwrite your original file!
Warning
Note also that edf and ELAN style hypnogram can only be saved or loaded with the default configuration for vigilance states.
1.5.3. Save hypnogram
Important
Since release v0.4, the default hypnogram export format uses stage duration rather than point-per-second encoding. This format avoids potential errors caused by downsampling and confusion in the values assigned to each vigilance state (which can drastically differ between two labs, e.g. N2 sleep can be encoded with the value 2 in one lab, and -2 in another lab). However, for retro-compatibility, we still allow user to save and load hypnogram in point-per-second format. Please see the image below to see the difference between stage-duration and point-per-second encoding.
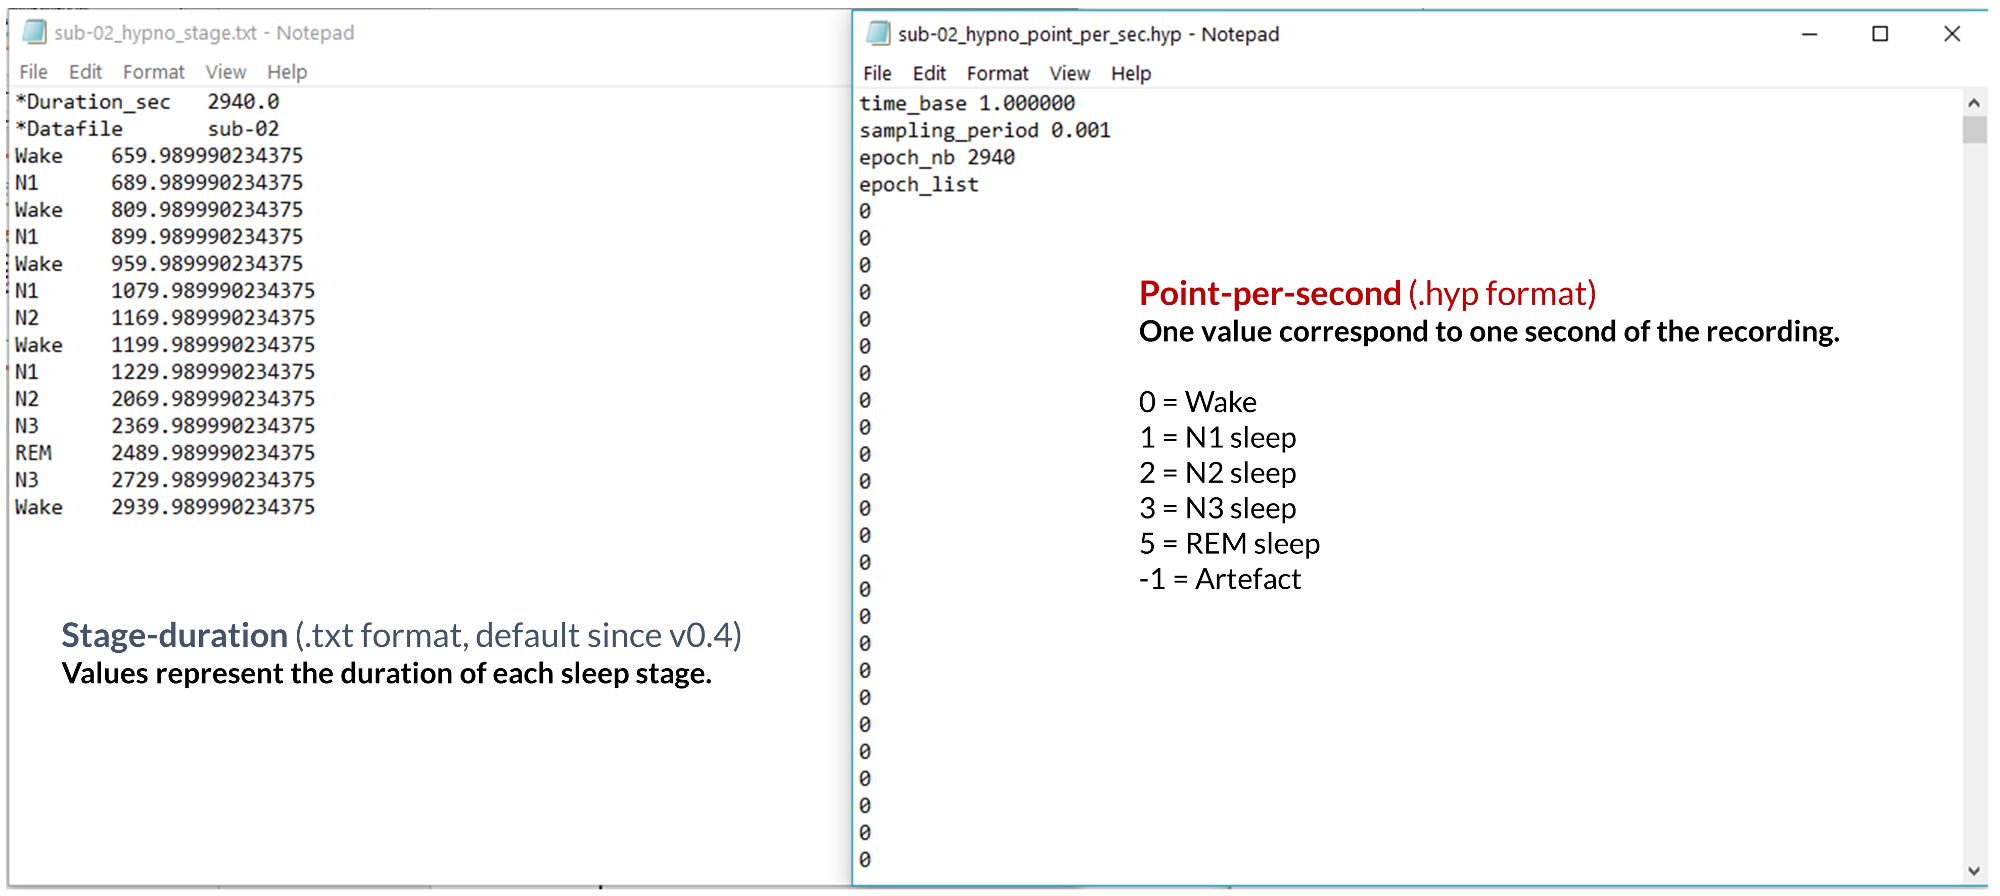
By default, Sleep will save your hypnogram in .txt, using the stage-duration encoding:
Stage |
Duration |
|---|---|
Wake |
500 |
N1 |
750 |
N2 |
2000 |
N3 |
3000 |
N2 |
3200 |
… |
… |
REM |
30018 |
Wake |
30100 |
How to read the example above?
The subject was awake from 0 to 500 seconds, then fell in N1 sleep between 500 to 750 seconds, then in N2 sleep between 750 to 2000 seconds, then in N3 sleep and so on. The subject was awakened in REM sleep, and the recording was stopped shortly after. The total duration of the recording (in seconds) corresponds to the last value of the hypnogram, in that case 30100 seconds.
The main advantages of using such an encoding format for the hypnogram is that it avoids any confusion related to the values used for each vigilance state, and drastically reduces the hypnogram file length without loosing any information. Please note that the software contains command-line functions to convert between point-per-second and stage-duration encoding.
Tip
If you want to add any relevant informations / comments to the hypnogram, you can do so by adding lines preceded by an asterisk directly within the text file. Sleep will not read any line in the hypnogram that starts with an asterisk mark. For example, you can add the name of the scorer:
*Scorer  John
*Date    05_17_2018
Wake     500
N1       750
1.5.3.1. Elan .hyp format
Alternatively, if you prefer point-per-second encoding, you can save your data in .hyp format, which can be read with any text editor. Sleep will create a single .hyp file with 4 header rows and the values presented above for the vigilance states, with the exception that the value assigned to REM sleep will be 5 for compatibility with Elan hypnogram reader.
This format (as well as EDF format) can only be saved or loaded in Sleep when using the default configuration for vigilance states.
Important
If your hypnogram was created using another software, and is encoded in point-per-second, it is important that Sleep knows which value is associated with each vigilance state (e.g. 2 = N2 sleep, 4 = REM sleep). To do that, you need to create a simple text file in the same directory as the original hypnogram file, named: HYPNOFILENAME_description.txt. Checkout this example.
This text file should contain the following information :
Parameters |
Values |
Description |
|---|---|---|
Time |
1 |
Hypnogram file contains one value per second |
Wake |
0 |
The value assigned to Wake in the hypnogram is 0 |
N1 |
1 |
The value assigned to N1 sleep in the hypnogram is 1 |
N2 |
2 |
The value assigned to N2 sleep in the hypnogram is 2 |
N3 |
3 |
The value assigned to N3 sleep in the hypnogram is 3 |
REM |
4 |
The value assigned to REM in the hypnogram is 4 |
Artefact |
-1 |
The value assigned to Artefact in the hypnogram is -1 |
1.6. Load your files
There are four ways to load datasets into Sleep:
1.6.1. Load file from the GUI
Don’t send anything, just open the interface and you will have a popup window asking for the filename of your data and hypnogram. If you do not have a hypnogram for your data and/or wish to display only the data, just press Cancel when the hypnogram popup opens.
# Import the Sleep module from visbrain :
from visbrain.gui import Sleep
# Run the interface :
Sleep().show()
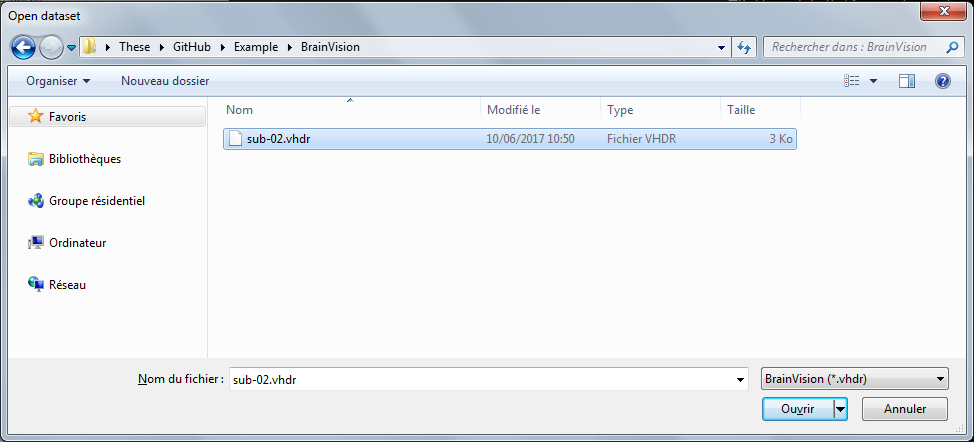
Popup window for loading your files.
1.6.2. Load file from path
Instead of leaving inputs arguments empty, send the path to the data :
# Import the Sleep module from visbrain :
from visbrain.gui import Sleep
# Define where the data are located :
dfile = '/home/perso/myfile.eeg'
# File for the hypogram :
hfile = '/home/perso/hypno.hyp'
# If you prefer to start with an empty hypnogram, just pass :
# hfile = None
Sleep(data=dfile, hypno=hfile).show()
1.6.3. Load file using MNE-Python
Finally, it is possible to load several other file formats using MNE Python package. The code below shows how to load either BDF, EGI or EEGLab files and pass them to Sleep.
# Import the Sleep module:
from visbrain.gui import Sleep
# - Biosemi Data Format (BDF)
data = 'mybdffile.bdf'
# - EGI format
# data = 'myegifile.egi'
# - EEGLab
# data = 'myeeglabfile.set'
# Now, pass all the data to the Sleep module :
Sleep(data=data).show()
1.6.4. Load file from raw data
It is possible to manually load raw data and pass them as inputs arguments Sleep. The code below show how to extract raw data from a Matlab .mat file (using SciPy):
from scipy.io import loadmat
# Import the Sleep module from visbrain:
from visbrain.gui import Sleep
# Load your dataset :
mat = loadmat('testing_database.mat')
# Get the data, sampling frequency and channel names:
raw_data, raw_sf, raw_channels = mat['data'], mat['sf'], mat['channels']
# For the hypnogram :
raw_hypno = mat['hypno']
# As before, if you prefer to start from a fresh empty one, use:
# raw_hypno = None or ignore passing this argument.
# Now, pass all the arguments to the Sleep module:
Sleep(data=raw_data, sf=raw_sf, channels=raw_channels,
      hypno=raw_hypno).show()
Warning
Data must be an array with shape (channels, samples). The number of channels must be the same as in channels variable. If you load an hypnogram this way, it must have the same number of point (i.e same sampling rate) as the data. If your hypnogram comes with a different time base, the simplest way is to export it into a simple txt file and follow the procedure described above.
1.7. Time-frequency
There are currently three time-frequency methods implemented in Sleep.
Name |
Method |
Dependency |
|---|---|---|
Fourier transform |
Fourier-based spectrogram (default) |
SciPy |
Wavelet |
Morlet’s wavelet |
None |
Multitaper |
Multitaper-based Wigner spectrogram |
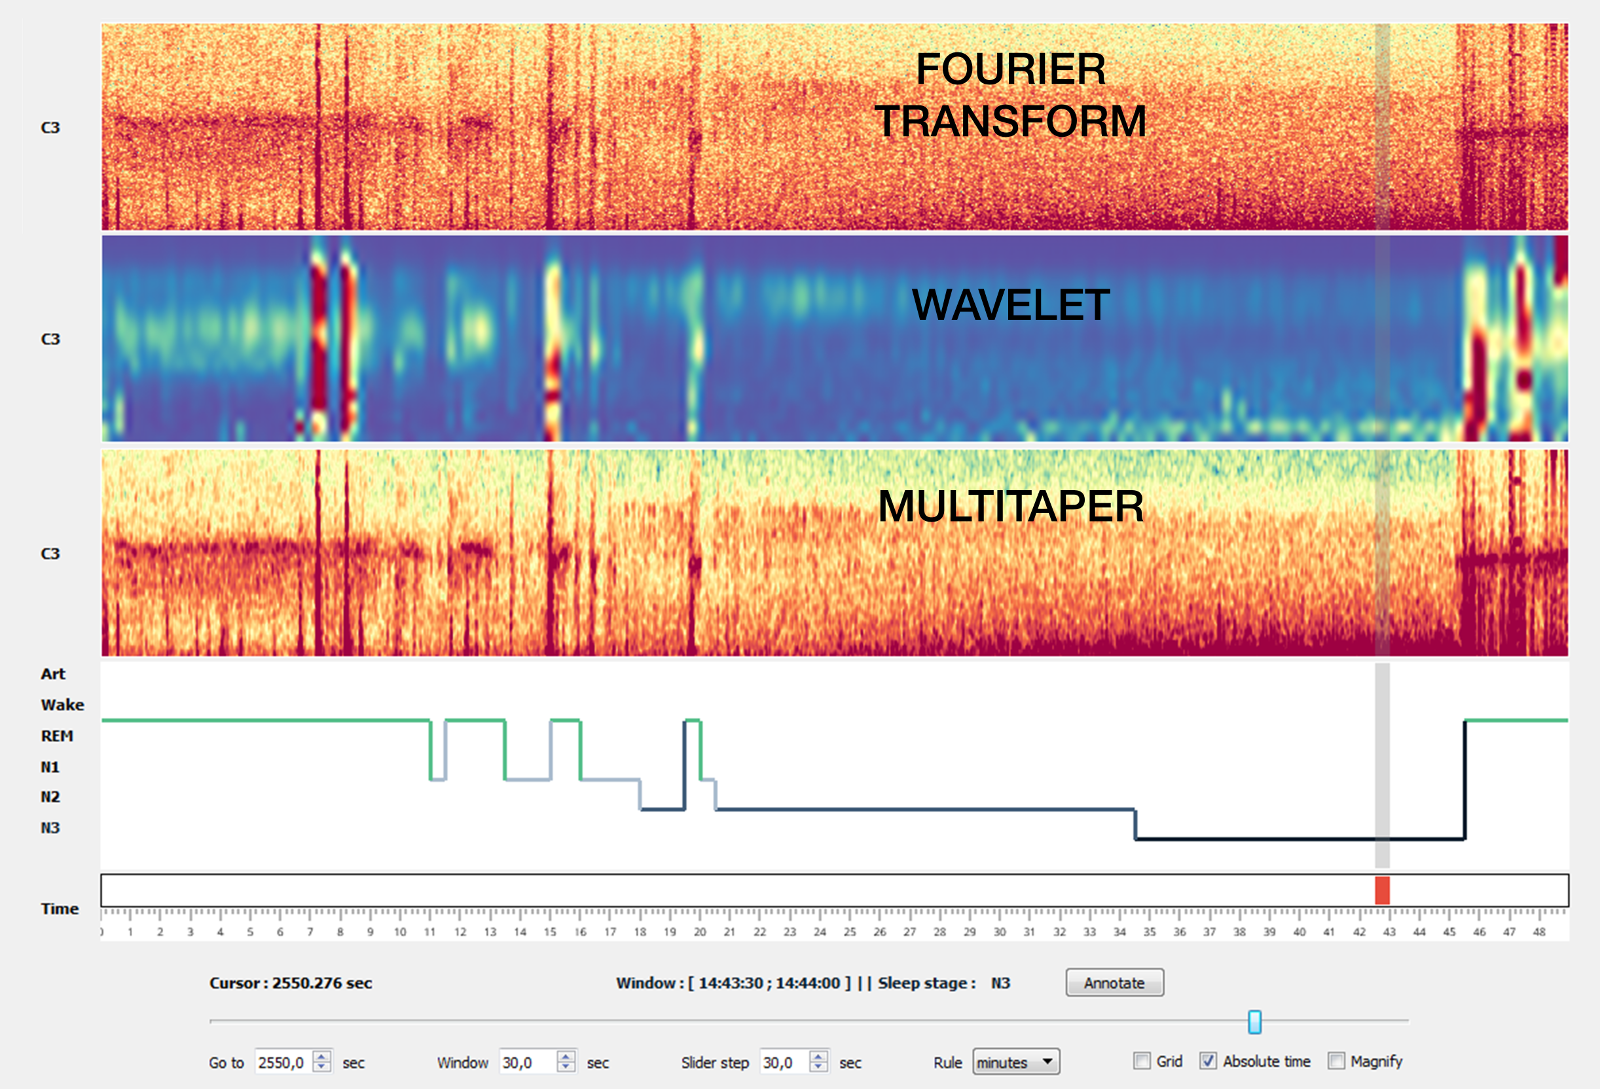
Comparison of the 3 methods on a 50 minutes recording (C3 electrode, 0.5-20 Hz).
Note
In most cases, the multitaper method is the one that gives the best results. To enable it, you must first install the lspopt package.
1.8. Hypnogram scoring
Sleep offers three possibilities to score the hypnogram: * using shortcuts, * using the Scoring table, * selecting epochs for scoring with the mouse (click and drag)
1.8.1. Scoring table
The Scoring panel can be used to manually edit the hypnogram values. It contains three columns:
From : specify where the stage start (in minutes)
To : specify where the stage finish (in minutes)
Stage : the stage type (use Art, Wake, N1, N2, N3 or REM. Can be lowercase)
At the end of the hypnogram, you can Add line or Remove line when a line is selected. An other interesting option is that the table is sortable (by clicking on the arrow inside the column name).
Note
You can export either the raw hypnogram values, the hypnogram scoring table, or a high-quality figure of the hypnogram using the Files > Save contextual menu.
1.8.3. Scoring with the mouse
By clicking and dragging the mouse on one of the channel axis, you can define an arbitrary “scoring window”, which can then be scored with one of the shortcuts.
Score the epoch or click a second time on one of the axis to dismiss the custom scoring window and revert to the default (centered) scoring window.
1.9. Apply semi-automatic detection
The Detection panel offers several semi-automatic algorithms for the detection of sleep features such as sleep spindles, K-complexes, rapid eyes movements, slow waves, muscle twitches and peaks. All detection types shared the following parameters :
Apply on : choose on which channel to perform the detection
Selected : apply detection on selected channel
Visible : apply detection on all visible channels
All : apply detection on all channels (even those that are hidden)
Note
After performing one of the detection, go to the Location tab to see infos about each detected events (starting and ending points, duration, vigilance state). Select the event to jump to it. Finally, you can export the location table using the File > Save contextual menu.
Two examples of automatic event detection are shown below.
1.9.1. Spindles detection
This algorithm perform a semi-automatic detection of sleep spindles which are an essential feature of N2 sleep. Sleep spindles are defined as bursts of 12-14 Hz waves that occur for at least 0.5 seconds. They are maximally visible on central electrodes.
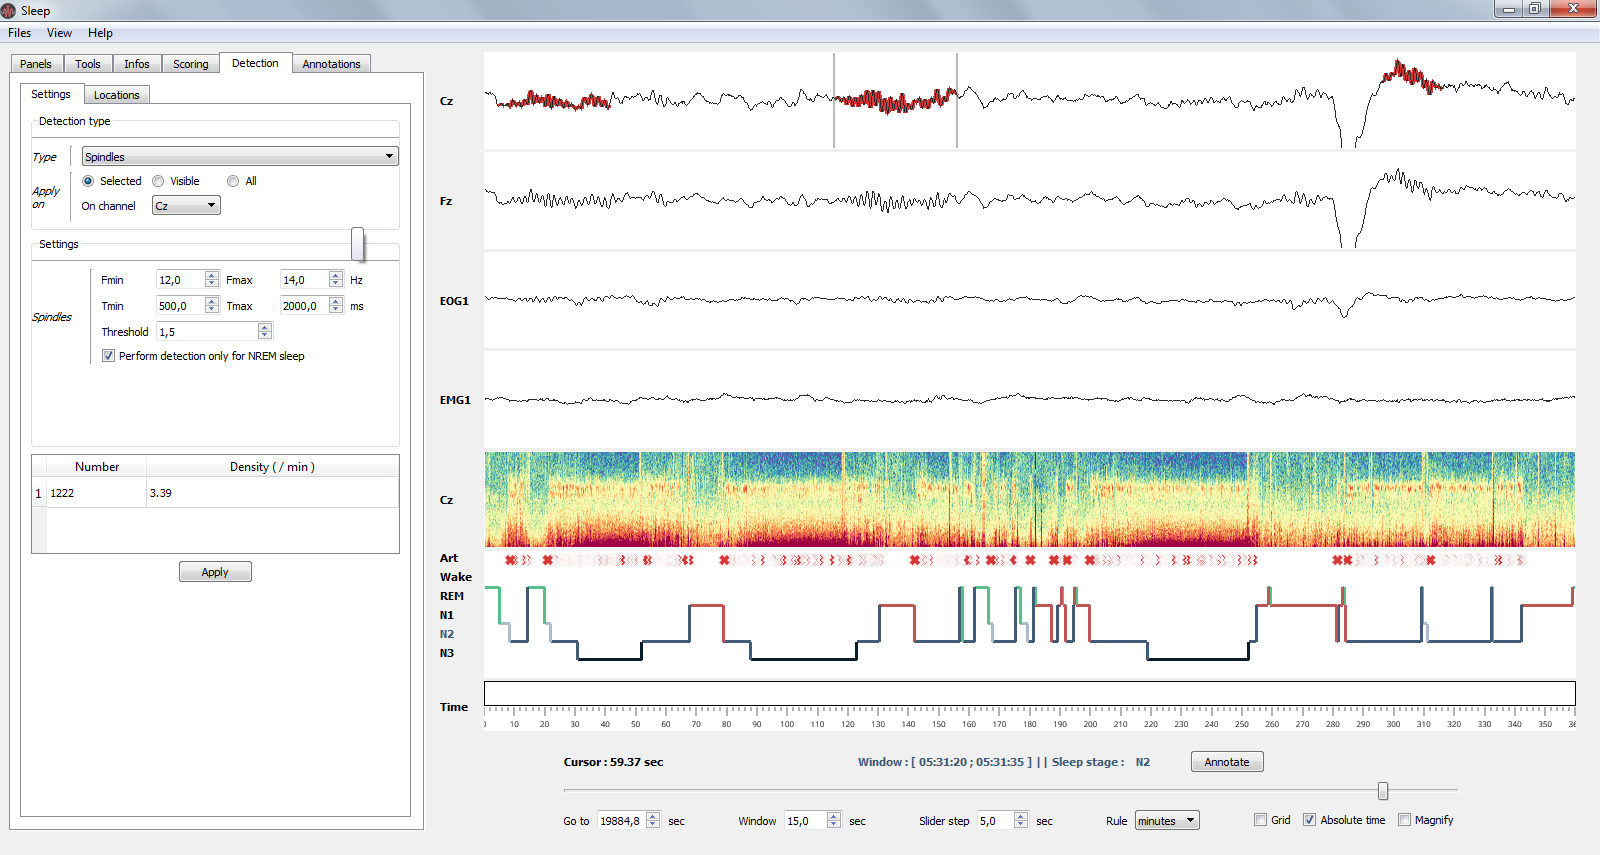
Spindles detection on channel Cz.
Note
- Parameters
Fmin : Highpass frequency, default 12 Hz
Fmax : Lowpass frequency, default 14 Hz
Tmin : Minimum duration, default 0.5 second
Tmax : Maximum duration, default 2 seconds
Threshold : defined as Mean + X * standard deviation of the signal. A higher threshold will results in a more conservative detection.
Perform detection only for NREM sleep : if True and a hypnogram is loaded, then the detection will only be performed on NREM sleep epochs.
1.9.2. Peaks detection
Perform a peak detection.
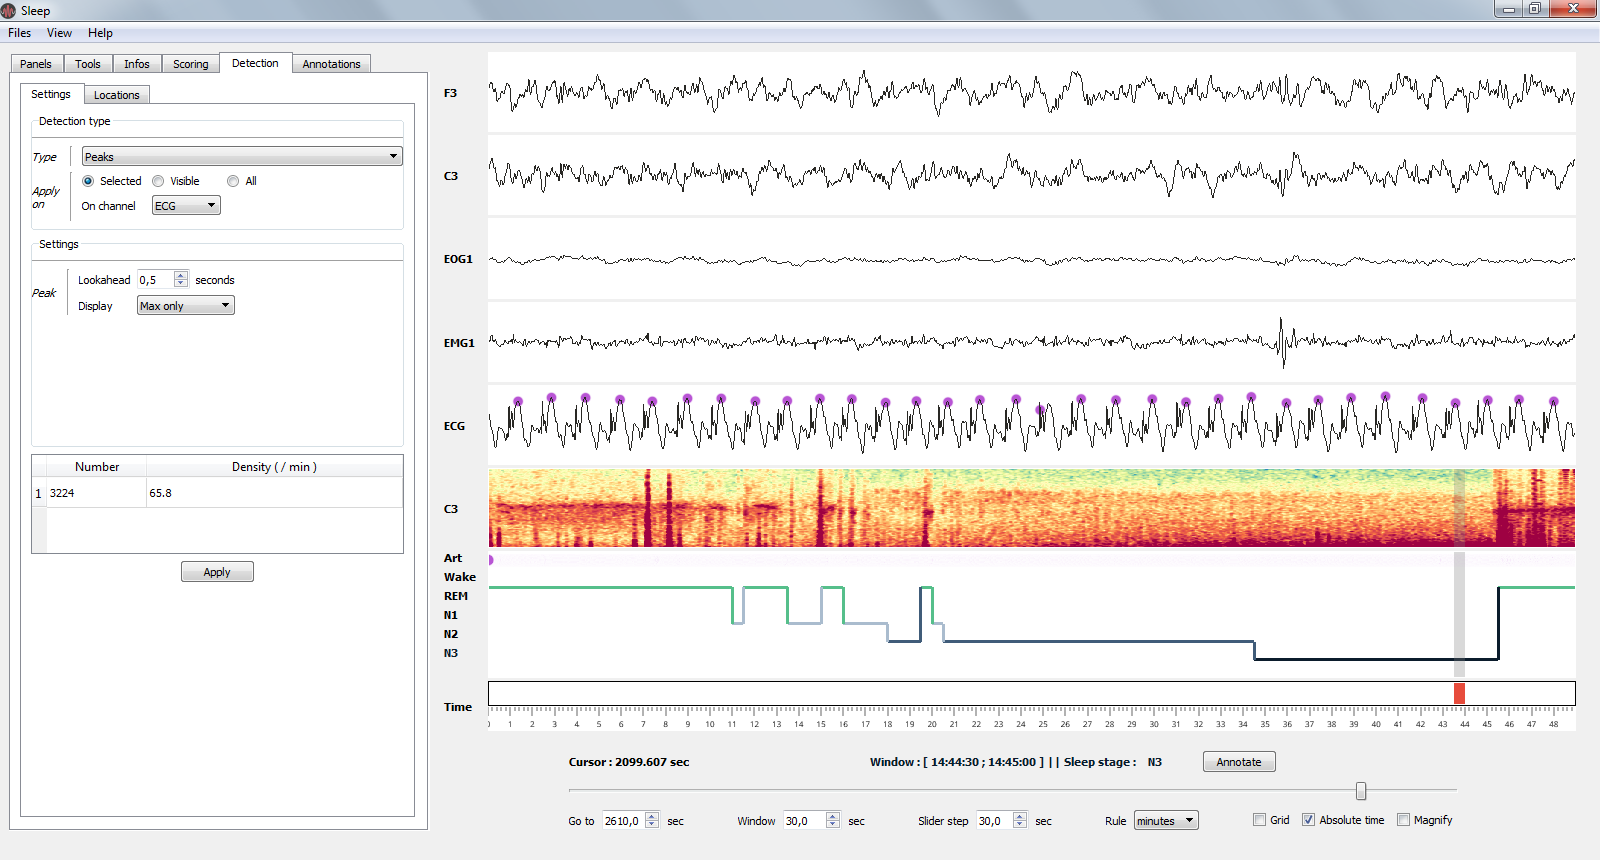
Peaks detection on ECG channel.
Note
- Parameters
Lookahead : minimum distance between two peaks.
Display : display either maximum / minimum / maximum & minimum
Important
Please note that the software does not yet allow to automatically score vigilance states. However, if you are interested to collaborate and / or implement your own algorithm, please feel free to contact us.
1.10. Use your own detections in Sleep
Sleep offers the possibility to replace the native detection algorithms with your own detection algorithms. To do it, you have to provide a function with predefined inputs and outputs.
1.10.1. Prototype of the function
Here’s a prototype of a function to replace Sleep spindle detections :
def my_custom_spindle_detection(data, sf, time, hypno):
    """Use your own spindle detection

    Parameters
    ----------
    data : np.ndarray
        Data of one unique channel (i.e shape (n_time_pts,))
    sf : float
         The sampling frequency (512., 1024. etc.)
    time : np.ndarray
        The time vector (i.e shape (n_time_pts,))
    hypno : np.ndarray
        The hypnogram (i.e shape (n_time_pts,))

    Returns
    -------
    indexes : np.ndarray
        indexes of detected events.
    """
    pass
1.10.2. Function output
For your convenience, Sleep accepts several possible output formats for your custom detection :
(Start, Stop) : an array of shape (n_dected_events, 2) where 2 describes the index where each event start and finish.
Boolean vector : a boolean vector of shape (n_time_pts,) where each True value refers to a time point that belong to a detected event.
Consecutive indexes : an array which only contains consecutive indexes of detected events.
It means that your function will work as long as you are able to return any one of these three possible vectors. Since it is very likely that your home-made detection function already return one of those, implementing it in Sleep should be fairly easy! A graphical representation of these output formats is displayed below:
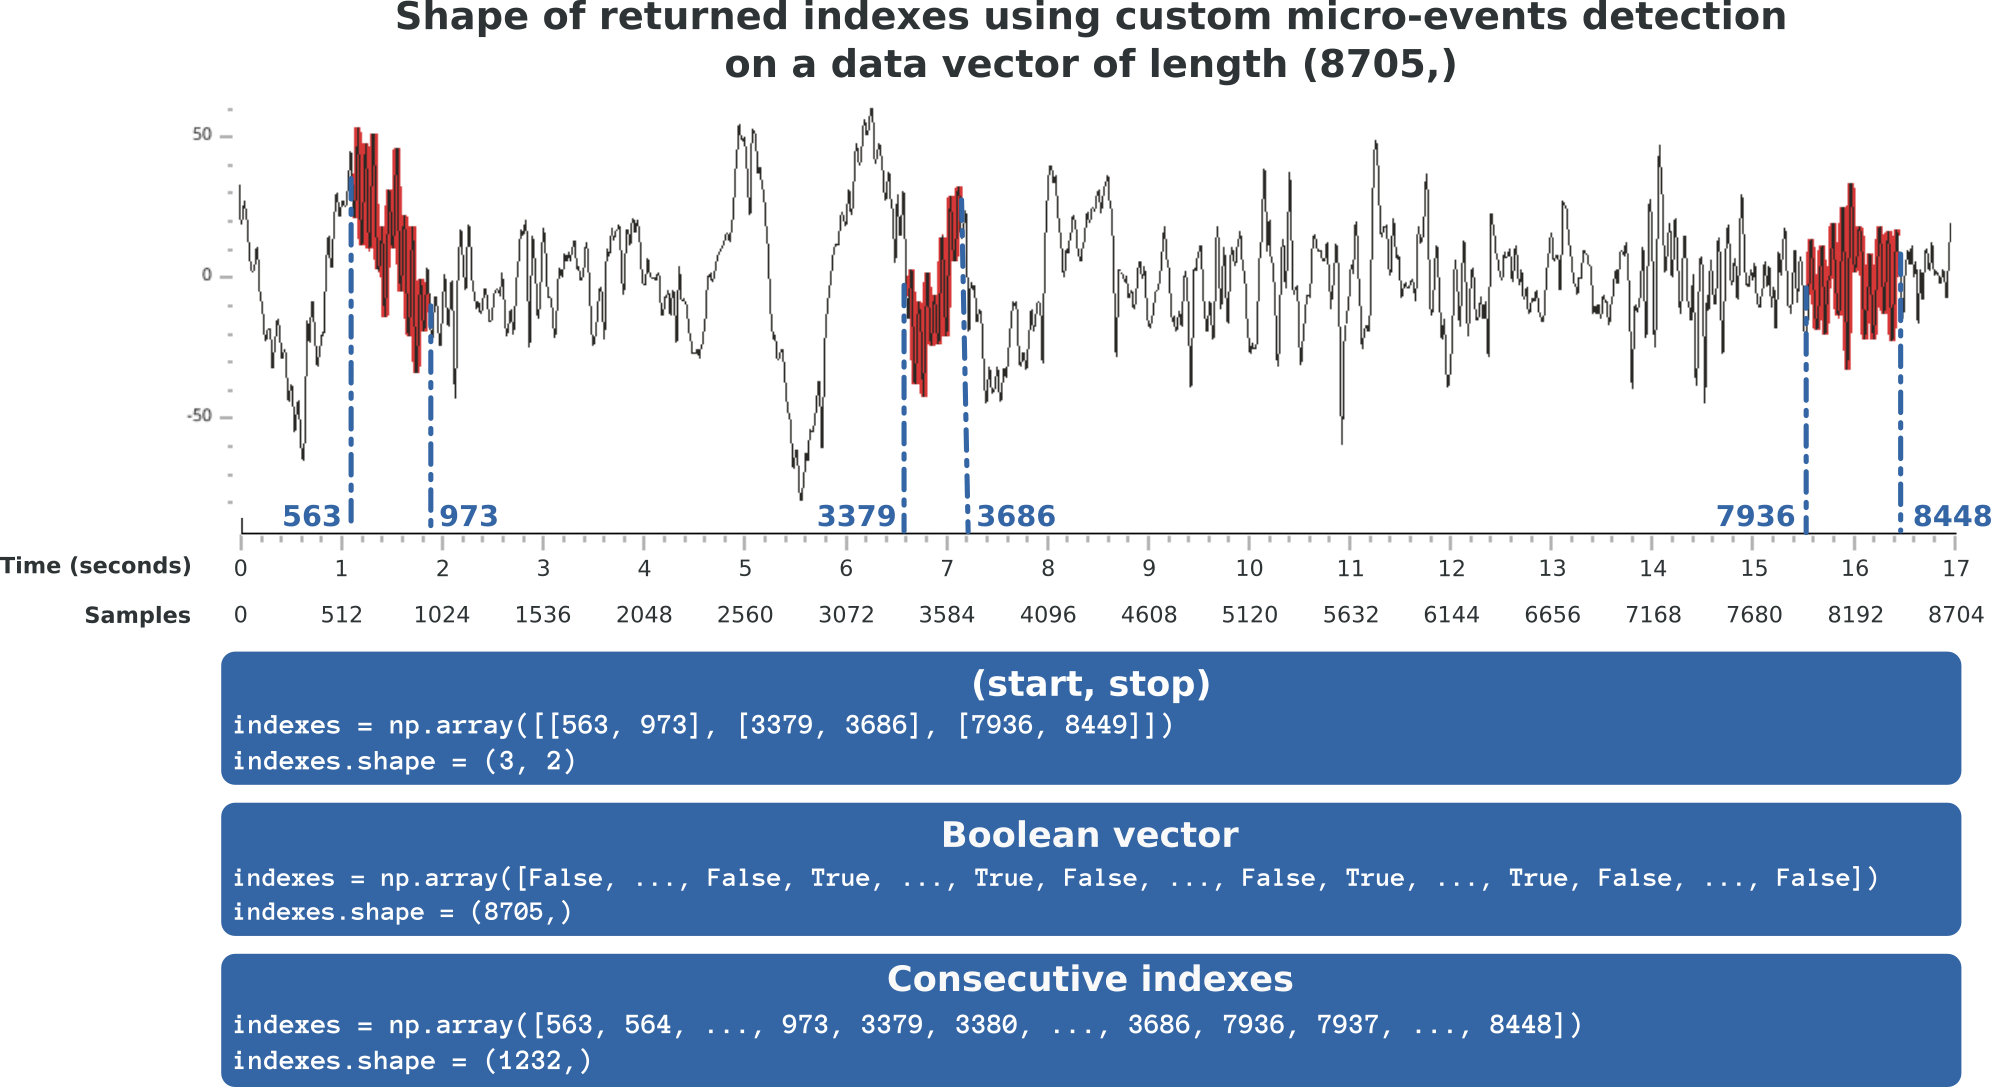
Supported output format of the custom detection algorithm.
1.10.3. Replace Sleep detection
Once your function has proper inputs and outputs, simply use the visbrain.gui.Sleep.replace_detections method to replace the detection of Sleep with your own. Please visit the Examples section to see some concrete examples.
1.11. Load and save the GUI configuration
From the Files > Save contextual menu, you can save the GUI configuration. This will save the state of all buttons and properties inside Sleep. Then, you can recharge the GUI configuration using Files > Load > GUI config.
Alternatively, if you want to use a configuration when running Sleep, you can use the config_file argument to directly pass the path to a configuration file. Note that configuration file are encoded in JSON format, which can be easily read and modified using any text editor.
from mne import io
# Import the Sleep module:
from visbrain.gui import Sleep

Sleep(config_file='pathto/myconfig.json')
1.12. Import, add and save annotations
Sleep provides a table for annotations. In this table, specify where the event start, finish and the associated text. Selecting a row of this table center the window around the selected time-code. This allow to quickly navigate even in large files.
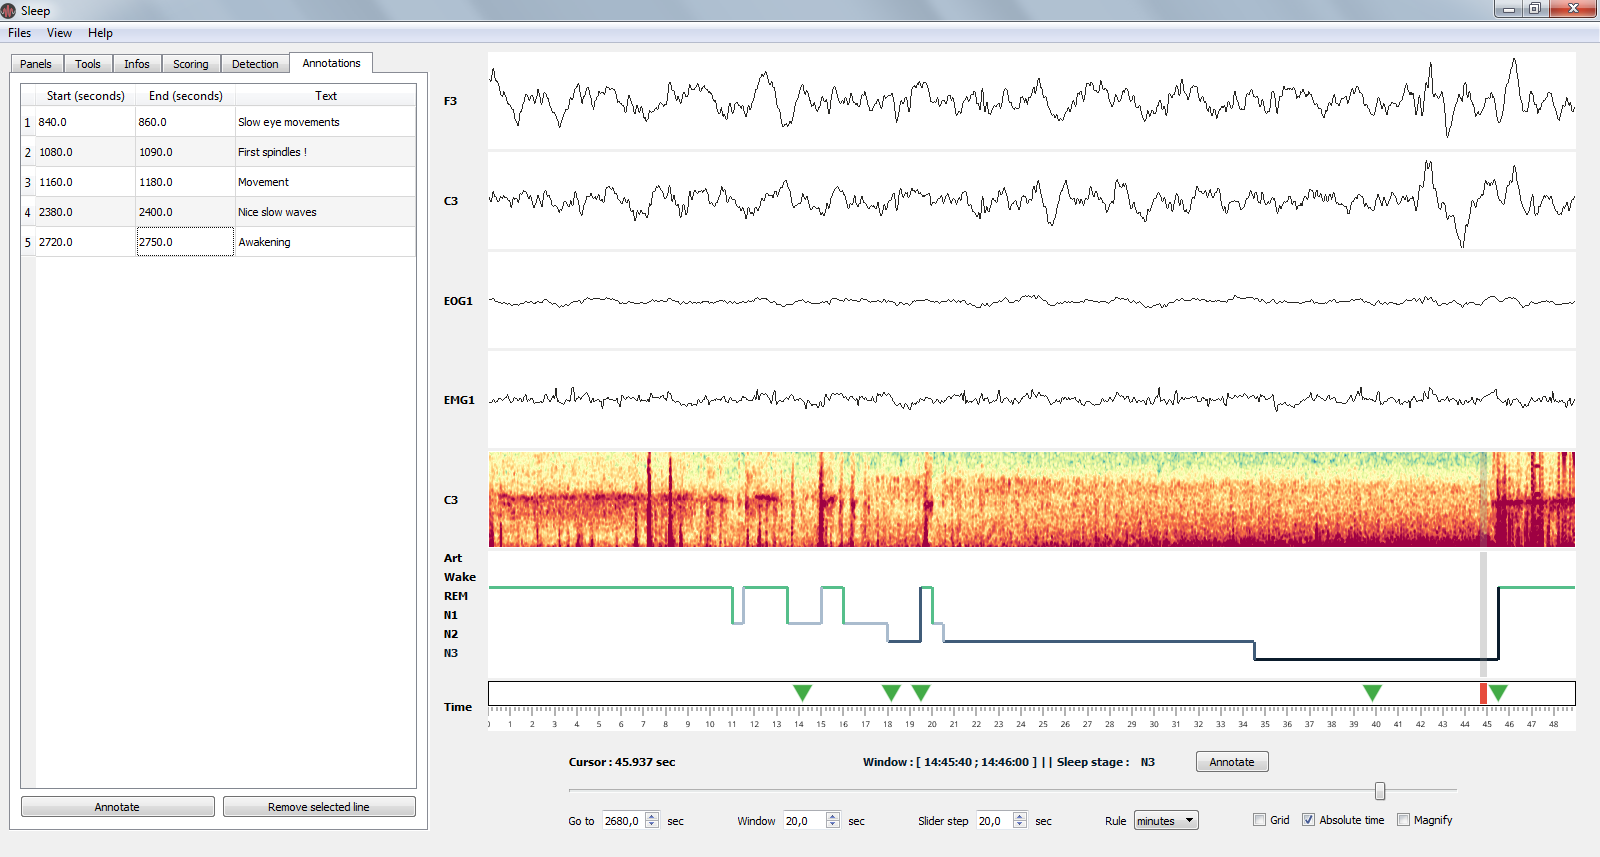
Annotations in Sleep. All annotations are referenced in a table in the quick settings panel (left). Each annotation is then reported in the time axis as a green triangle.
1.12.1. Import annotations
If the interface is opened, load annotations from the menu Files > Load > Annotations. Otherwise, you can use the input variable annotations to set the path to an existing annotation file that need to be loaded. There is several ways to define annotations :
1.12.1.1. Annotations in a text file
Annotations can be defined in a csv file or in a txt file file.
from mne import io
# Import the Sleep module:
from visbrain.gui import Sleep

Sleep(annotations='pathto/myannotations.txt')
1.12.1.2. Using MNE-Python annotations
Alternatively, you can use annotations from MNE-python and pass your annotations to the annotations variable :
import numpy as np
from mne import Annotations
from visbrain.gui import Sleep

# Define the onset, duration and description :
onset = np.array([117., 256., 312.])
durations = np.array([5, 10, 4])
description = np.array(['First event', 'Second event', 'Third event'])
annot = Annotations(onset, durations, description)

Sleep(annotations=annot)
1.12.1.3. Define only markers
Annotations can be seen as the combination of a time-code and a label. If you don’t need a label to your event, you can only specify the time-code in seconds:
import numpy as np
from visbrain.gui import Sleep

# Define the onset :
onset = np.array([117., 256., 312.])

Sleep(annotations=onset)
1.12.2. Add new annotations
To add new annotations :
From the ruler or from the Annotations tab of the quick settings panel, use the Annotate button to annotate the currently displayed window
Double clicking on a canvas is an other way to quickly add annotations.
1.12.3. Save annotations
The list of annotations can be exported (either in .txt or .csv) or loaded from the Files contextual menu.
1.13. Examples
1.13.1. Examples using visbrain.gui.Sleep


Load EDF file with custom vigilance state configuration