Note
Go to the end to download the full example code.
Plot a 1D signal
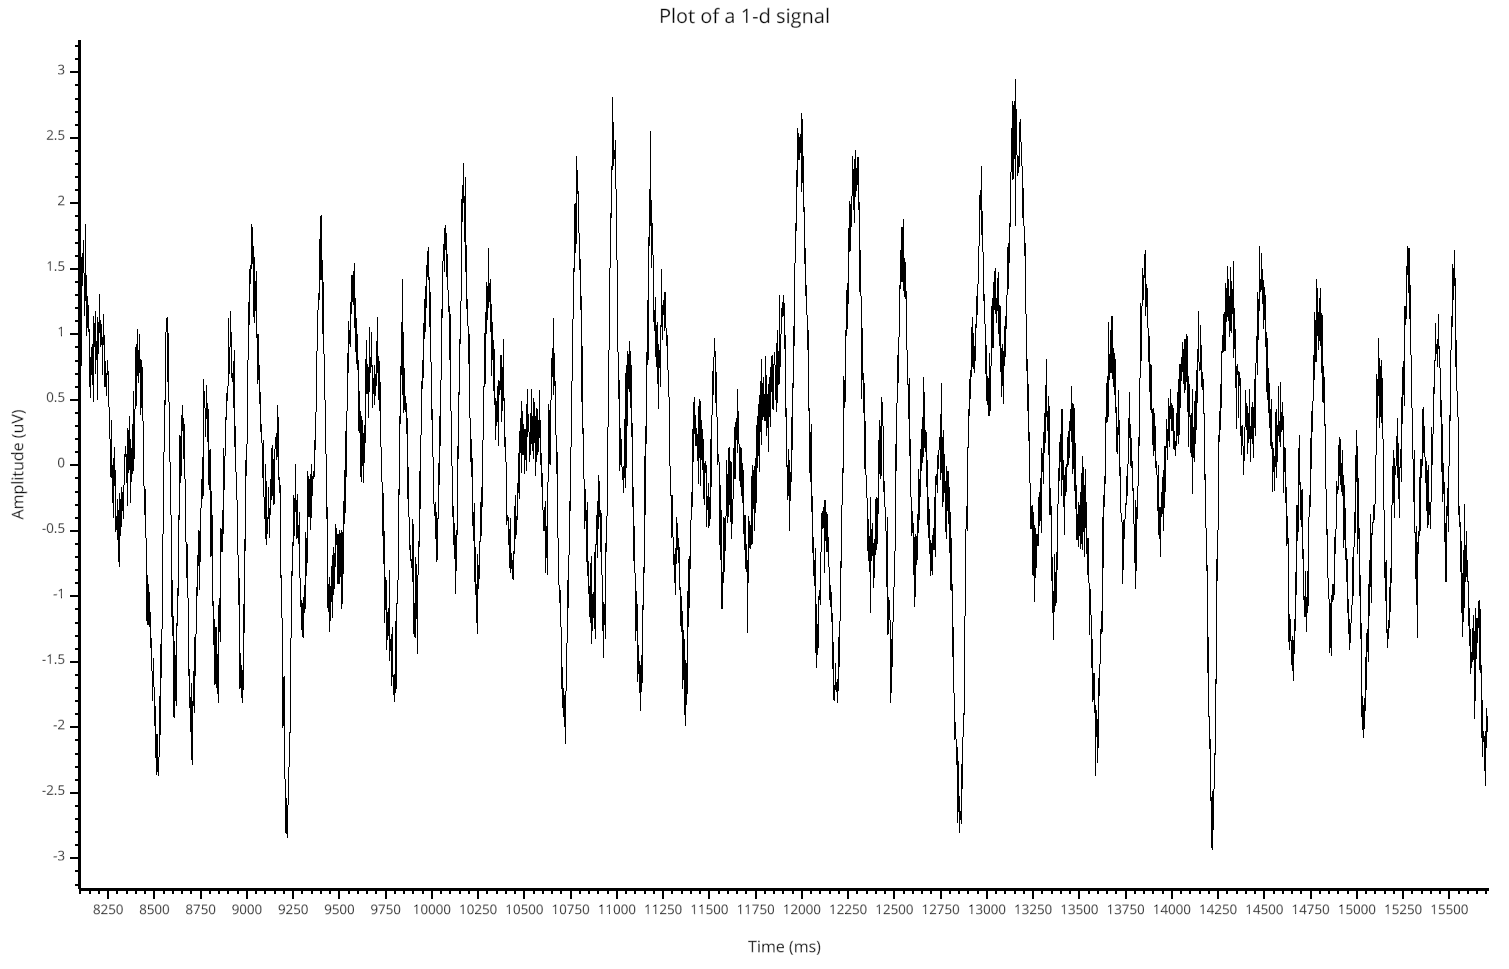
Plot a basic vector. Then, you can visualize this vector as a continuous line, markers, histogram or compute the time-frequency map or power spectrum density (PSD).
Shortcuts
Mouse wheel : to zoom over the canvas
Mouse press and hold : to move the center of the camera
Double click : insert an annotation under the mouse cursor
<delete> : reset the camera
from visbrain.gui import Signal
from visbrain.utils import generate_eeg

sf = 512.  # sampling frequency
n_pts = 4000  # number of time points

"""Generate a random EEG vector of shape (n_pts,). Also get the associated
time vector with the same length as the data.
"""
data, time = generate_eeg(sf=sf, n_pts=n_pts)
time += 8.  # force the time vector to start at 8 seconds
time *= 1000.  # millisecond conversion

"""Add a label to the x-axis (xlabel), y-axis (ylabel) and a title
"""
xlabel = 'Time (ms)'
ylabel = 'Amplitude (uV)'
title = 'Plot of a 1-d signal'

Signal(data, sf=sf, time=time, xlabel=xlabel, ylabel=ylabel,
       title=title).show()