Note
Go to the end to download the full example code.
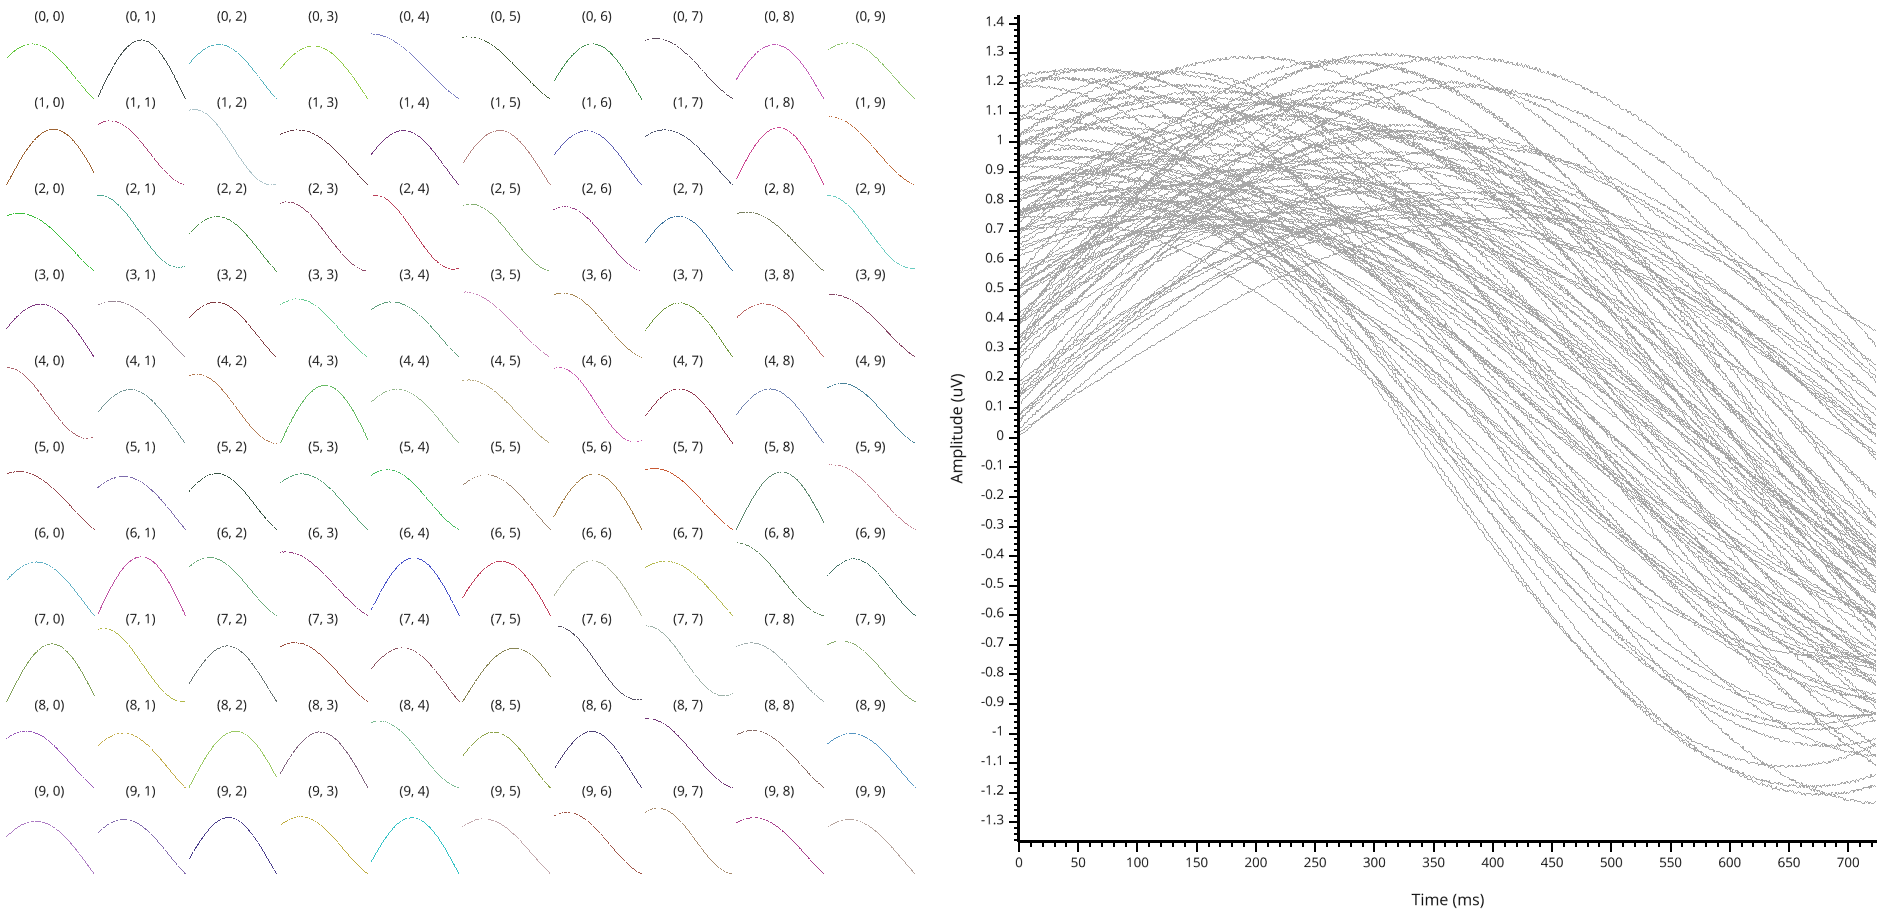
Butterfly plot
Superimposition of all the signals.
import numpy as np
from visbrain.gui import Signal


sf = 1024.  # Sampling frequency
n_pts = 1000  # Number of time points
n_sines = 100  # Number of sines
f_sines = (.4, .6)  # (Min, Max) sines frequencies

"""Generate the time vector
"""
time_2d = np.mgrid[0:n_sines, 0:n_pts][1] / sf
time = time_2d[0, :] * 1000.

"""Generate a random dataset to illustrate the butterfly
"""
phy = np.random.uniform(0., np.pi / 2., n_sines)
f_sines = np.random.uniform(f_sines[0], f_sines[1], (n_sines, )).reshape(-1, 1)
data = np.sin(2 * np.pi * f_sines * time_2d + phy.reshape(-1, 1))
data += np.random.rand(*data.shape) / 100.
data *= np.random.uniform(.7, 1.3, (n_sines, )).reshape(-1, 1)

Signal(data, time=time, form='butterfly', xlabel='Time (ms)',
       ylabel='Amplitude (uV)', color='darkgray').show()