1. Figure

1.1. Description
This module can be used to arange several exported figures in a grid, to control background colors, colorbar (either one per picture or shared colorbar…)
from visbrain.gui import Figure
1.2. Example
# Import the Figure module :
from visbrain.gui import Figure

# Set the list of files to load :
files = ['front.png', 'top.png', 'connect.png', 'connect.png']

# Define titles, xlabels and ylabels :
title = ['Front', 'Top', 'Transp', 'Connect']
xlabels = ['xlab0', None, None, 'xlab3']
ylabels = ['ylab0', None, None, 'ylab3']

# Define the background color of each axis : the two last pictures are
# transparent brains. By setting the background color to 'slateblue' and
# '#ab4642', brains turn respectively to blue and red :
ax_bgcolor = [None, None, 'slateblue', '#ab4642']

# Define the Figure object :
f = Figure(files, titles=titles, figtitle='My figure', xlabels=xlabels,
           ylabels=ylabels, grid=(2, 2), ax_bgcolor=ax_bgcolor, y=1.,
           fig_bgcolor=(0.098, 0.098, 0.098), figsize=(12, 12),
           text_color='white', autocrop=True)

# Add a colorbar only to the second axis :
f.colorbar_to_axis(1, (0, 1), 'viridis', title='Repartition', ticks='complete',
                   vmax=.9, over='#ab4642', fz_ticks=12,
                   vmin=.1, under='gray')

# Add a colorbar only to the third axis :
f.colorbar_to_axis(2, (-1, 10), 'Spectral_r', title='Connectivity', ticks='minmax',
                   vmax=8, over='#ab4642', fz_ticks=12,
                   vmin=0, under='gray', orientation='horizontal')

# Add a vertical shared colormap :
f.shared_colorbar((-10, 10), 'inferno', fz_title=30, vmin=-7, vmax=6,
                  under='olive', over='firebrick', position='right',
                  title='Shared vertical colorbar', fz_ticks=20, pltmargin=.1,
                  figmargin=.1)

# Add a horizontal shared colormap :
f.shared_colorbar(cmap='magma', clim=(-17, 17), fz_title=25, vmin=-11, vmax=12,
                  under='olive', over='firebrick', position='bottom',
                  title='Shared horizontal colorbar', fz_ticks=15, pltmargin=.1)

# Save the final figure in 600 dpi:
f.save('figlayout.png', dpi=600)

# Alternatively, you can show the figure :
f.show()
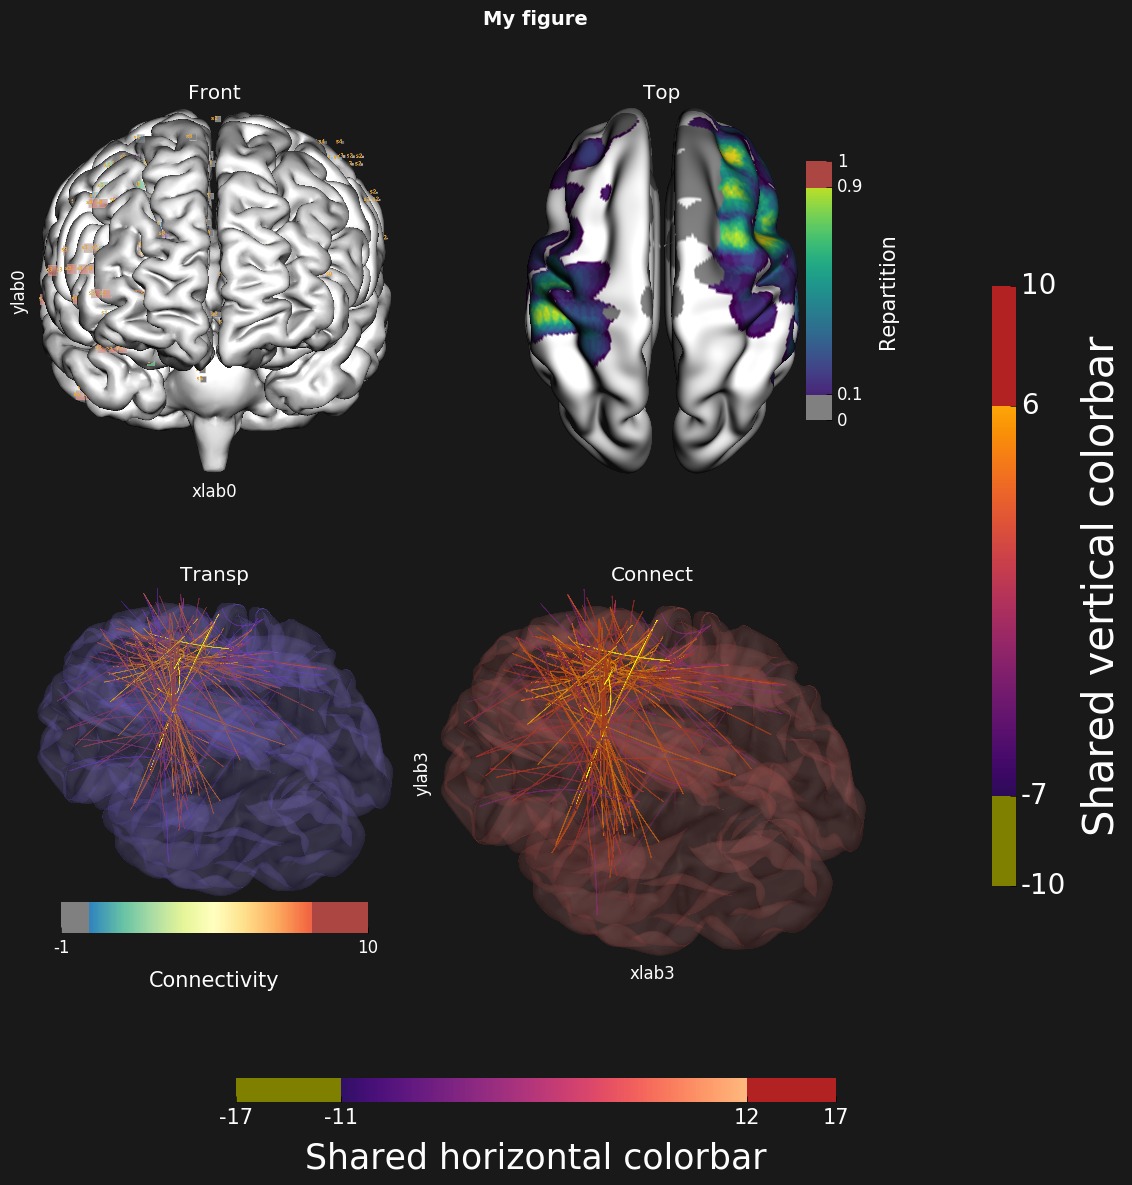
Code above : four exported figures from the Brain module are aranged in a (2, 2) grid. Then, some have a colorbar, xlabel, ylabel. Finally, there is two shared colorbars.